We now know how to analyze pure compounds, but what if we have a mixture? Spectrophometry becomes quite complex when dealing with multiple species of compounds at once. In order to purify a compound we can separate if from a mixture based on its intrinsic chemical properties. Remember that fluorescein is negatively charged at a pH above pKa of the carboxyl group. We can take advantage of this fact and use its attraction to positive charges to separate it from other molecules. In ion-exchange chromatography, we will use a stationary phase with a positive charge, allowing negatively charged molecules to bind and positively charged species to flow through. We can then disrupt this interaction and retrieve our now-purified molecule, and use spectrophotometric analysis of our purified fractions to determine how well we were able to separate our molecules.
Learning Goals
To pour and run a chromatography column,
To relate previously established concepts of pK, and charge to the principles of ion-exchange chromatography, and
To further develop spectroscopic techniques in the analysis of proteins and molecules.
We now know how to analyze pure compounds, but what if we have a mixture? Spectrophometry becomes quite complex when dealing with multiple species of compounds at once. In order to purify a compound we can separate if from a mixture based on its intrinsic chemical properties. Remember that fluorescein is negatively charged at a pH above pKa of the carboxyl group. We can take advantage of this fact and use its attraction to positive charges to separate it from other molecules. In ion-exchange chromatography, we will use a stationary phase with a positive charge, allowing negatively charged molecules to bind and positively charged species to flow through. We can then disrupt this interaction and retrieve our now-purified molecule, and use spectrophotometric analysis of our purified fractions to determine how well we were able to separate our molecules.
Learning Objectives
To pour and run a chromatography column,
To relate previously established concepts of pK, and charge to the principles of ion-exchange chromatography, and
To further develop spectroscopic techniques in the analysis of proteins and molecules.
Ion Exchange Chromatography Lecture
Buffers Lecture
Materials
Spectrophotometer
Micropipettors
Parafilm®
Solutions of cytochrome c (from horse) SDS and fluorescein SDS
Chromatography column DE 52 anion-exchange resin (~10 mL of slurry) SDS in 100mM Tris⋅Cl, pH 8*
To run an anion exchange column and separate a mixture of an organic dye and a protein on the basis of charge differences.
Protocol
Part I. Preparing the Column. Prepare you chromatography column by attaching fittings as instructed by your TA. Ensure that the bottom valve is closed and add 5 mL co water in the column. Indicate the 5mL mark with a Sharpie and add another ~20mL of water. Then, open the bottom valve to let the water flow out of the column until the level of liquid is about 1cm above the plastic frit at the bottom of the column, at which time you should again close the bottom valve. Your TA will provide you with a slurry containing the DE52 anion-exchange resin. You should gently rock the container of slurry to suspend the resin uniformly, and then you should add ~10 mL of the slurry to your column. Open the valve at the bottom of the column, allow the remaining buffer, which should be above the top of the resin bed. at this time switch the valve to the closed position and carefully add, in a manner that does not disturb the resin bed, 5 mL of 10mM Tris⋅Cl, pH 8 to the column. Switch the valve at the bottom of the column to the open position to allow the buffer to flow through the column. Repeat this process 4 more times so that a total of 5 column volumes pass through the column. Why is this done? After the 5 column volumes have passed through the resin, you can close the valve at the bottom of the column. The level of buffer should be ~1 cm above the level of the resin bed.
Part II. Adding the Sample and Running the Column. Your TA will give you a solution that contains a mixture of fluorescein and cytochrome c in 10 mM Tris⋅Cl, pH 8. Open the valve at the bottom of the column, and allow the buffer to flow down the column until its level is just above the top of the resin bed, at which time you should close the bottom valve. Carefully load the mixture of fluorescein and cytochrome c into the column such that the top of the resin bed is not disturbed. Open the bottom valve and allow the mixture to enter the resin. As this mixture is passing through the column, being collecting 2-mL fractions in tubes that have previously been calibrated and marked to indicate the 2-mL level. (As you begin to collect fractions, you also should start reading the absorbance values of your fractions as described in Part III below.) Once the level of the mixture is just above the top of the resin bed, close the bottom valve. Carefully add ~5 mL of 10 mM Tris⋅Cl, pH 8 "wash" buffer so as not to disturb the resin bed, and then open the bottom valve and continue collecting 2-mL fractions -- adding more wash buffer as necessary -- until you have collected ~12 fractions. Close the valve at the bottom of the column when the level of the last of the wash buffer is just above the resin bed. Carefully add 2 mL of the elution buffer ( 1 M NaCl in 10 mM Tris⋅Cl, pH 8), and allow this elution buffer to pass through the column. When the level of elution buffer is just above the resin bed, close the valve. Continue collecting 2-mL fractions as this elution is occurring. Repeat this process until the elution is not visibly colored. Then, still taking care not to disturb the resin bed, add a larger volume of elution buffer and continue eluting until 5 column volumes pass through the column. Again, continue collecting 2-mL fractions throughout this process. When you are done running the column, add the resin to the collection beaker indicated by your TA.
Table 3.1 Relevant physicochemical data of fluorescein and cytochrome c used in the experiment. Extinction coefficients are given in terms of M−1cm−1 unless otherwise specified.
Molecule
Mr
ϵ240
ϵ280
ϵmg/mL405
Fluorescein
332
76,000
---
---
Cytochrome c
11,384
---
11,460
6.1
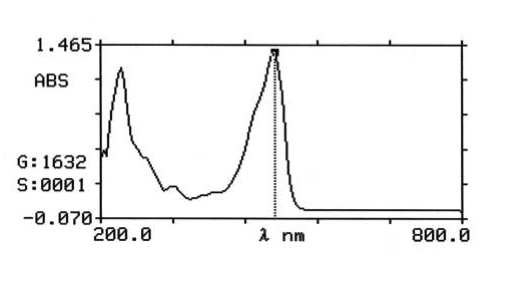
Part III. Spectrophotometric Analysis of the Fractions. Read the absorbance values of your fractions, using 10 mM Tris⋅Cl, pH 8 buffer as a blank. Plot the absorbance at each of the appropriate wavelengths (see table 3.1) versus fraction number. In other words, read all fractions at 280 nm, 405 nm, and 490 nm (instead of scanning all wavelengths, which would take too long). Interpret the plots in terms of what you know about chemical properties of 1) the component molecules, 2) what you visually observed during the experiment, and 3) what you observe in the plots of absorbance vs. wavelength (200 - 800 nm) of the two molecules (see Figures 3.1 and 3.2). In your discussion of your results, explain the elution profile of the two molecules and compare the outcomes you attained with the expectations you had given the physicochemical properties of the component molecules (i.e., estimates of the pl of each molecule that you determined in the recent Take-Home Quiz, the data in Table 3.1, and the plots of absorbance vs. wavelength shown in figures 3.1 and 3.2. Also, given the extinction coefficeints and molecular weights of the two component molecules, estimate the amount of the protein component two different ways, as suggested in the Table below, and discuss the extent to which the two methods agree or do not agree. Explain any discrepancies that you note.
Figure 3.1 Absorbance vs. wavelength of fluorescein. The indicated peak shows a λmax of 490nm.
3-1_2.png
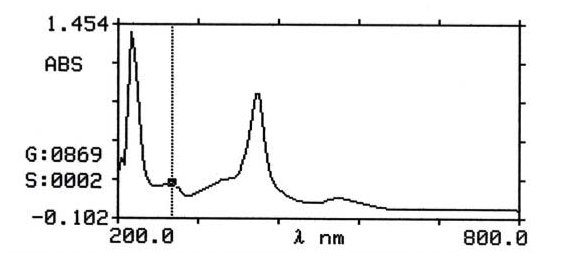
Figure 3.2 Absorbance vs. wavelength of cytochrome c. The indicated peak is a 280 nm. The prominent peak to the right of the indicated peak shows a λmax of 405 nm.
Taylor, Cody. "Ion-Exchange Chromatography". OER Commons. Institute for the Study of Knowledge Management in Education, 06 Feb. 2015. Web. 19 Apr. 2024. <https://oercommons.org/authoring/6940-ion-exchange-chromatography>.
Taylor, C. (2015, February 06). Ion-Exchange Chromatography. OER Commons. Retrieved April 19, 2024, from https://oercommons.org/authoring/6940-ion-exchange-chromatography.