Previously, we showed how different compounds absorb light. The chemical structure of a molecule determines exactly how much light it absorbs, as well as which wavelengths are absorbed. It stands to reason then, that by removing an atom from a molecule, we can change the way it absorbs light. In this experiment, we will relate these two concepts by measuring the absorbance of a molecule under acidic and basic conditions. The changing pH will allow us to find how strongly a specific hydrogen is attached to our molecule, and we will observe how the changing chemical structure affects the observed absorbance. Afterwards, using mathematical analysis, we can experimentally determine the pKa, or affinity of our hydrogen to our parent molecule.
Learning Goals
To understand how changes in structure can impart changes on the properties of a molecule, and
To use various data fitting models to experimentally determine the pKa of fluorescein
Previously, we showed how different compounds absorb light. The chemical structure of a molecule determines exactly how much light it absorbs, as well as which wavelengths are absorbed. It stands to reason then, that by removing an atom from a molecule, we can change the way it absorbs light. In this experiment, we will relate these two concepts by measuring the absorbance of a molecule under acidic and basic conditions. The changing pH will allow us to find how strongly a specific hydrogen is attached to our molecule, and we will observe how the changing chemical structure affects the observed absorbance. Afterwards, using mathematical analysis, we can experimentally determine the pKa, or affinity of our hydrogen to our parent molecule.
Learning Objectives
To understand how changes in structure can impart changes on the properties of a molecule, and
To use various data fitting models to experimentally determine the pKa of fluorescein
Fluorescein
Nonlinear Fitting Lecture
Materials
Handout 2.1: Discussion of Simple Linear Regression (PDF)
Handout 2.2: Using the LINEST Function in Spreadsheets (PDF)
Spectrophotometer with UV lamp turned on at the beginning of lab
Part I. Preparing the buffers. In medium test tubes, prepare your buffers by combining the pH 4 and pH 10 buffers as indicated in table 2.1. When you have added the solution components to a tube, tightly cover the tube with a square of Parafilm®, invert to thoroughly mix, and then label the tubes 1, 2, 3, etc. Measure and record (in your lab notebook) the pH values of the resulting buffer solutions according to the instructions provided by the TA. You can use Table 2.1 as a model. For anticipated acidic solutions, standardize your pH meter from 4 - 7; for anticipated basic solutions, standardize your pH meter from 7 - 10. Try to keep the electrode centered in the test tubes when you measure the pH of each solution.
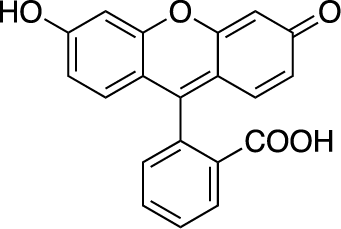
Figure 2.1 Chemical structure of fluorescein
fluorescein-structure.png
In a basic solution, which proton will be lost first? How do you know?
Part II. Spectrophotometric determination of the pKa of fluorescein. Obtain an aliquot of the fluorescein solution from the TA. Set the spectrophotometer to read 240 and 490nm, and then blank the spectrophotometer with the appropriate volume (which the TA will provide) of the pH 4 solution. Add the necessary volume of the fluorescein solution to bring the total volume to 1000μL, and then cover the cuvette tightly with Parafilm® and invert several times to mix. Read the sample, and record the absorbance readings at these two wavelengths. If the A240 reading is significantly less or greater than 0.3, then repeat the above process but use a more concentrated or dilute sample as necessary until the A240 is approximately 0.3. Repeat this process with the remaining buffer solutions taking care to blank the spectrophotometer with each new buffer. This is data set 1. If time allows, collect another set of data, which we will call set 2. you likely will find that your A490 readings for the pH 4 and 10 solutions are below and above, respectively, the linear range of the spectrophotometer. The A240 readings, however, should all be within linear range of the spectrophotometer. Dispose your excess solutions in the aqueous waste container as directed by your TA.
Part III. Analyzing the data In Excel, plot as functions of pH both your A240 and A490readings of both sets of data. Use nonllinear fitting (as described in Part II of the handout "pH, pKa, Solver, and All That" to calculate/estimate the pKa of fluorescein. Use the A240 readings of the first set of data, then repeat the above process but use the A490 readings of the first set of data. Repeat the above process with the second set of data. Next uselinear fitting (as described in Part III of the handout "pH, pKa, Solver, and All That" ) to calculate/estimate the pKa of fluorescein. Use both wavelengths and both sets of data as discussed above. Finally, use the second derivative approach (as described in Part IV of the handout "pH, pKa, Solver, and All That") to calculate/estimate the pKa of fluorescein. Again, use both wavelengths and both sets of data as discussed above. In addition to estimating the pKa of fluorescein, you should make plots of your data and the best-fit lines using all three of the above approaches, as described in the handout.
Table 2.1 Making buffers with pH values from 4 - 10
Solution
μL pH 4 buffer
μL pH 10 buffer
μL dH2O
Total volume(μL)
Approx. pH
Actual pH
1
200
0
1800
2000
4
2
190
10
1800
2000
4.3
3
180
20
1800
2000
4.6
4
170
30
1800
2000
4.9
5
160
40
1800
2000
5.2
6
150
50
1800
2000
5.5
7
140
60
1800
2000
5.8
8
130
70
1800
2000
6.1
9
120
80
1800
2000
6.4
10
110
90
1800
2000
6.7
11
100
100
1800
2000
7
12
90
110
1800
2000
7.3
13
80
120
1800
2000
7.6
14
70
130
1800
2000
7.9
15
60
140
1800
2000
8.2
16
50
150
1800
2000
8.5
17
40
160
1800
2000
8.8
18
30
170
1800
2000
9.1
19
20
180
1800
2000
9.4
20
10
190
1800
2000
9.7
21
0
200
1800
2000
10
Some caveats: When you fit these data, let the Aobs, 240 of the pH 10 solution be the initial guess of the value of ab at this wavelength. Also, let the Aobs, 240 of the pH 4 solution be the initial guess of the value of Aa at this wavelength. If the fitted value of one of these parameters is unreasonable (i.e., is negative) then repeat the fit but hold that parameter fixed at the original value. The same holds true for the Aobs, 290 data. Calculate the average (and standard deviation) of the pKaestimates that were obtained with each of the approaches. For example, calculate the average and standard deviation of the pKa estimate that was obtained from the nonlinear fitting of sets 1 and 2 using the A240 values. Repeat these calculations using the A490 values of sets 1 and 2 and so on for all three approaches of estimating the pKa. Comparing the averages of your estimates with thereported pKa value that you find on Wikipedia, and again, discuss the extent to which your experimental estimates agree with the reported estimate. In addition to handing in a lab report next week, one person from each group will send to your respective TAs an Excel file that contains your group's data.
Taylor, Cody. "pKa of Fluorescein". OER Commons. Institute for the Study of Knowledge Management in Education, 06 Feb. 2015. Web. 24 Apr. 2024. <https://oercommons.org/authoring/6934-pka-of-fluorescein>.
Taylor, C. (2015, February 06). pKa of Fluorescein. OER Commons. Retrieved April 24, 2024, from https://oercommons.org/authoring/6934-pka-of-fluorescein.