Spectrophotometry, Spectroscopy, and Protein Determinations
Lab 1
We are all well aware of the composition of the world -atoms form molecules, compound become more complex, and the organization of these atoms into materials with unique structures is what brings about life. As scientists though, we must study these substances , which presents a challenge. How do we study something so incredibly small? One of the simplest methods is spectrophotometry. Different molecules will interact with light in different ways. By studying this, we can quantitatively say both how much light a compound absorbs as well as what kind of light. Certain functional groups tend to absorb light at certain wavelengths, giving "peaks" to the spectrum of light absorption. This lab demonstrates basic principles of absorbance, measured using spectrophotometers.
Learning Objectives
- To use the Beer-Lambert equation to relate the concentration and absorbance of a solution,
- To use a spectrophotometer in the proper manner,
- To become familiar with the Bradford Assay, and
- To utilize a standard curve to relate an unknown to established parameters.
Materials
- Spectrophotometer
- Micropipettors
- Parafilm®
- Solutions of riboflavin SDS, fluorescein SDS, 1.0 M Tris-Cl buffer, pH8*, bovine serum albumin (BSA) SDS
- Calculator
- Spreadsheet program (e.g., Excel)
Objective
To become familiar with the Beer-Lambert Law, A=ϵcl, from determinations of the UV-Vis spectra of riboflavin and flourescein; to practice spectroscopic techniques for the quantitative determination of protein concentrations in solution.
Protocol
Part I. Absprption Spectrum of Riboflavin. At the start of the lab, your TA will provide instructions for powering up the spectrophotometer. In addition, you will be told how to turn on the deuterium lamp, which is used for readings in the UV range. Your TA also will give you a solution concentration (
Table 1.1 Relevant physicochemical data of flourescein and riboflavin. Extinction coefficients are given in terms of
| Molecule | Mr | E240 | E490mg/ml |
| Fluorescein | 332 | --- | 229 |
| Riboflavin | 376 | --- | --- |
From its molecular mass (376g/mol) and measurements of visible and UV spectra, determine
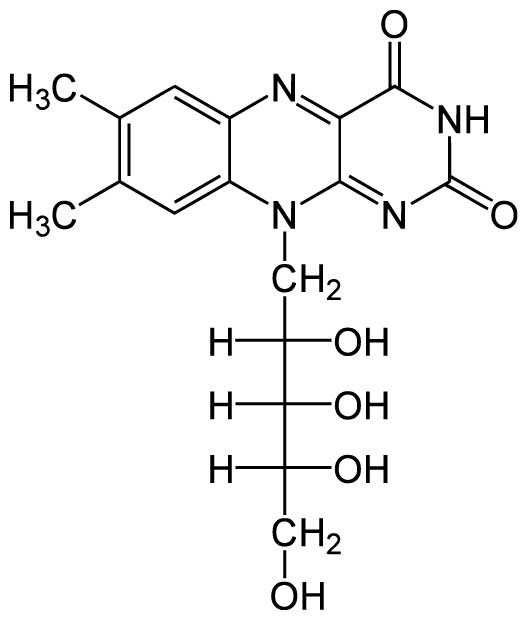
Figure 1.1 Chemical structure of riboflavin
Part II. Fluorescein. Your TA will give you a solution of fluorescein of unknown concentration and 0.3 mL of 1.0 M Tris
Blank the spectrophotometer with 900
Figure 1.2 Chemical structure of fluorescein
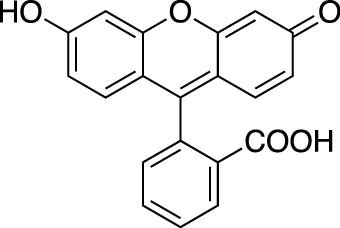
fluorescein_structure.jpgFluorescein Structure
Part III. Bradford Assay. Your TA will give you a solution of bovine serum albumin (BSA; 1 mg/mL). You will make a series of appropriate dilutions and plot a standard curve using the following protocol:
- Prepare a range of standards (1.00mL volumes in 1.5 mL tubes) containing: 0.2 mg/mL, 0.4 mg/mL, 0.6 mg/mL, and 0.8 mg/mL of BSA. The fifth sample will be undiluted (1.0 mg/mL) BSA. You will use these same samples to construct you standard curve, which is a part of the Bradford assay.
- Obtain six microcentrifuge tubes (1.5 mL size) and add 990
μ L of Bradford reagent to each of these tubes. (Note: Your TA has already diluted the Bradford reagent 1:4.) Next, add 10μ L of dH2 O to one of the tubes. This tube will be your blank. - Add 10
μ L of the 0.2 mg/mL BSA sample to a second tube, 10μ L of the 0.4 mg/mL BSA sample to a third tube and so on until you have used all of the BSA samples. - Cap each tube and be sure to label these tubes.
- Mix the samples by gentle inversion of the tubes (about 5 times), and allow the samples to stand for 5 minutes.
- After 5 minutes, add the blank mixture to one of the cuvettes and zero (or blank) the spectrophotometer at 595 nm. Dispose of the blank solution in the appropriate waste container and then add the lowest-concentration sample to the same cuvette and read the
A595 . This sample can be disposed as described above, and then add the next sample (in order of increasing concentration) to the same cuvette that held the blank and the first sample. The new sample will be read, disposed of, and the process repeated until the last, highest-concentration sample is read. - When you are done, clean the cuvette you used. You will need to use an acetone rinse to remove the residual Bradford reagent from this cuvette. Although this method is not ideal (in a perfect world we would use a clean cuvette for each sample), it should work for our purposes.
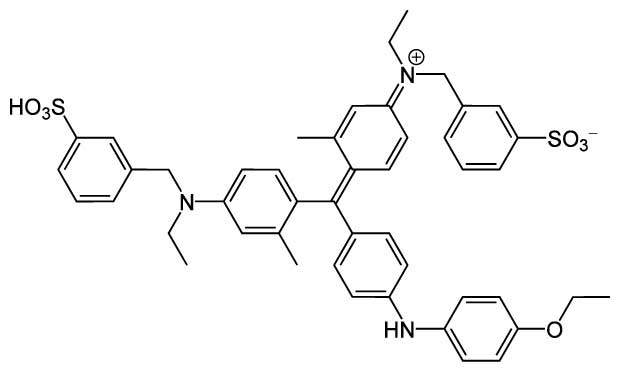
Figure 1.3 Coomassie Brilliant Blue G-250, whose absorbance shift is observed in a Bradford assay
Part IV. Standard Curve. Using the data from the solution of BSA (1 mg/mL) that was provided, each student in the group will plot a standard curve of the absorbance readings at 595 nm (
Interactive 1.1 Crystal Structure of Bovine Serum Albumin
Media will be placed here
Shown with bound calcium (green spheres) and acetate ligands. PDB accession number: 3v03
Part V. Protein Samples of Unknown Concentration. Your TA will give you different solutions containing different concentrations of different "unknown" proteins. (We, of course, know the identities and concentrations of these proteins.) Prepare each of these samples for Bradford analysis as described above and read the