Algebra 1 Project Based Learning
Project Based Learning Project
Algebra 1
Purposes:
1.Teach students how to collect data.
2.Students will learn how to analyze data.
3.Being able to create different kinds of graphs to display their data.
Lesson Summary:
Students will conduct surveys and then use their data to create graphs. Students will break into groups and come up with a multiple-choice question. They will then go out and have people answer their questions and record their data on a chart. After they have recorded enough data they will construct a graph displaying the information. The students must present their graphs to the class and discuss their results and how they displayed them.
Lesson Narrative
Intro: Teacher will go over instructions and expectations for the project.
Presentations: Students will explain their graphs to the class. They will describe how the conducted their survey, why they chose that graph, and how they went about transcribing their data to the graph.
Debriefing: Students get the chance to discuss what graphs they found the easiest to understand and which ones were the easiest to make. They will get a chance to relate their experiences to lessons we have learned in the class and to graphs we have learned about.
Culminating Activity
1.Below are the attachments needed to complete the survey. Each student must have their own survey page however, the question and options should remain the same.
2.After deciding on a question and options for the survey each student needs to go and ask at least 15 people for their answer.
3.Once the survey is completed students need to fill out one more survey sheet and compile all their data onto one sheet.
4.They will then need to decide what kind of graph they are going to use to display their information.
a.Choose from pie chart, bar graph, linear graph, or picture graph
5.On a poster, they will need to create their graph.
a.Must include title, labeled axis, and a key
i.Rubric Below
6.Then students will share their data in front of the class.
7.After presentations, will be a discussion.
a.Discussion topics include
i.What graphs were the easiest to understand?
ii.Which graphs were the easiest to create?
iii.How does this correlate to what we have learned in class?
PBL Project Survey Page
Names:
Group Number:
Period:
Survey Question: ______________________________________________________
Option 1:______________________________________________________________
Option 2:______________________________________________________________
Option 3:______________________________________________________________
Option 4:______________________________________________________________
Survey Results:
| Option | # of times selected | Probability of being selected (percent) |
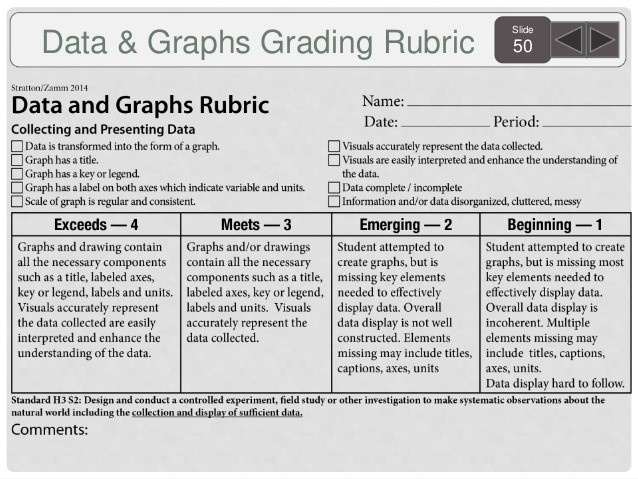
Rubric for Project