Samples and ProbabilityType of Unit: ConceptualPrior KnowledgeStudents should be able to:Understand the …
Samples and ProbabilityType of Unit: ConceptualPrior KnowledgeStudents should be able to:Understand the concept of a ratio.Write ratios as percents.Describe data using measures of center.Display and interpret data in dot plots, histograms, and box plots.Lesson FlowStudents begin to think about probability by considering the relative likelihood of familiar events on the continuum between impossible and certain. Students begin to formalize this understanding of probability. They are introduced to the concept of probability as a measure of likelihood, and how to calculate probability of equally likely events using a ratio. The terms (impossible, certain, etc.) are given numerical values. Next, students compare expected results to actual results by calculating the probability of an event and conducting an experiment. Students explore the probability of outcomes that are not equally likely. They collect data to estimate the experimental probabilities. They use ratio and proportion to predict results for a large number of trials. Students learn about compound events. They use tree diagrams, tables, and systematic lists as tools to find the sample space. They determine the theoretical probability of first independent, and then dependent events. In Lesson 10 students identify a question to investigate for a unit project and submit a proposal. They then complete a Self Check. In Lesson 11, students review the results of the Self Check, solve a related problem, and take a Quiz.Students are introduced to the concept of sampling as a method of determining characteristics of a population. They consider how a sample can be random or biased, and think about methods for randomly sampling a population to ensure that it is representative. In Lesson 13, students collect and analyze data for their unit project. Students begin to apply their knowledge of statistics learned in sixth grade. They determine the typical class score from a sample of the population, and reason about the representativeness of the sample. Then, students begin to develop intuition about appropriate sample size by conducting an experiment. They compare different sample sizes, and decide whether increasing the sample size improves the results. In Lesson 16 and Lesson 17, students compare two data sets using any tools they wish. Students will be reminded of Mean Average Deviation (MAD), which will be a useful tool in this situation. Students complete another Self Check, review the results of their Self Check, and solve additional problems. The unit ends with three days for students to work on Gallery problems, possibly using one of the days to complete their project or get help on their project if needed, two days for students to present their unit projects to the class, and one day for the End of Unit Assessment.
Statistics is the study of variability. Students who understand statistics need to …
Statistics is the study of variability. Students who understand statistics need to be able to identify and pose questions that can be answered by data that vary. The purpose of this task is to provide questions related to a particular context (a jar of buttons) so that students can identify which are statistical questions. The task also provides students with an opportunity to write a statistical question that pertains to the context.
Students extend their understanding of compound events. They will compare experimental results …
Students extend their understanding of compound events. They will compare experimental results to predicted results by calculating the probability of an event, then conducting an experiment.Key ConceptsStudents apply their understanding of compound events to actual experiments.Students will see there is variability in actual results.Goals and Learning ObjectivesContinue to explore compound independent events.Compare theoretical probability to experimental probability.
This is a task from the Illustrative Mathematics website that is one …
This is a task from the Illustrative Mathematics website that is one part of a complete illustration of the standard to which it is aligned. Each task has at least one solution and some commentary that addresses important aspects of the task and its potential use.
This course covers descriptive statistics, the foundation of statistics, probability and random …
This course covers descriptive statistics, the foundation of statistics, probability and random distributions, and the relationships between various characteristics of data. Upon successful completion of the course, the student will be able to: Define the meaning of descriptive statistics and statistical inference; Distinguish between a population and a sample; Explain the purpose of measures of location, variability, and skewness; Calculate probabilities; Explain the difference between how probabilities are computed for discrete and continuous random variables; Recognize and understand discrete probability distribution functions, in general; Identify confidence intervals for means and proportions; Explain how the central limit theorem applies in inference; Calculate and interpret confidence intervals for one population average and one population proportion; Differentiate between Type I and Type II errors; Conduct and interpret hypothesis tests; Compute regression equations for data; Use regression equations to make predictions; Conduct and interpret ANOVA (Analysis of Variance). (Mathematics 121; See also: Biology 104, Computer Science 106, Economics 104, Psychology 201)
Lecture for the course "CS 217 – Probability and Statistics for Computer …
Lecture for the course "CS 217 – Probability and Statistics for Computer Science" delivered at the City College of New York in Spring 2019 by Evan Agovino as part of the Tech-in-Residence Corps program.
This site teaches High Schoolers how to Make Inferences and Justify Conclusions …
This site teaches High Schoolers how to Make Inferences and Justify Conclusions using statistics through a series of 99 questions and interactive activities aligned to 4 Common Core mathematics skills.
Lecture for the course "CS 217 – Probability and Statistics for Computer …
Lecture for the course "CS 217 – Probability and Statistics for Computer Science" delivered at the City College of New York in Spring 2019 by Evan Agovino as part of the Tech-in-Residence Corps program.
This lesson unit is intended to help teachers assess how well students …
This lesson unit is intended to help teachers assess how well students are able to: Understand conditional probability; represent events as a subset of a sample space using tables and tree diagrams; and communicate their reasoning clearly.
Lesson OverviewStudents will extend their understanding of probability by continuing to conduct …
Lesson OverviewStudents will extend their understanding of probability by continuing to conduct experiments, this time with four-colored spinners. They will compare experimental results to expected results by first conducting an experiment, then calculating the probability of an event.Key ConceptsThis lesson takes an informal look at the Law of Large Numbers, comparing experimental results to expected results.Goals and Learning ObjectivesLearn about experimental probability.Compare theoretical probability to experimental probability and show that experimental probability approaches theoretical probability with more trials.Use proportions to predict results for a number of trials.
An Introduction to Statistics Short Description: Significant Statistics: An Introduction to Statistics …
An Introduction to Statistics
Short Description: Significant Statistics: An Introduction to Statistics was adapted and original content added by John Morgan Russell. It is adapted from content published by OpenStax Introductory Statistics, OpenIntro Statistics, and Introductory Statistics for the Life and Biomedical Sciences. NewParaNote to instructors: This book is undergoing active peer review and copyediting. It may change. Please complete this form https://bit.ly/stat-interest to be notified of the status of the book.NewParaSignificant Statistics: An Introduction to Statistics is intended for the one-semester introduction to statistics course for students who are not mathematics or engineering majors. It focuses on the interpretation of statistical results, especially in real world settings, and assumes that students have an understanding of intermediate algebra. In addition to end of section practice and homework sets, examples of each topic are explained step-by-step throughout the text and followed by a 'Your Turn' problem that is designed as extra practice for students. NewParaInstructors reviewing, adopting, or adapting this textbook, please help us understand your use by filling out this form: https://bit.ly/stat-interest.
Long Description: Significant Statistics: An Introduction to Statistics is intended for the one-semester introduction to statistics course for students who are not mathematics or engineering majors. It focuses on the interpretation of statistical results, especially in real world settings, and assumes that students have an understanding of intermediate algebra. In addition to end of section practice and homework sets, examples of each topic are explained step-by-step throughout the text and followed by a ‘Your Turn’ problem that is designed as extra practice for students.
Word Count: 198073
(Note: This resource's metadata has been created automatically by reformatting and/or combining the information that the author initially provided as part of a bulk import process.)
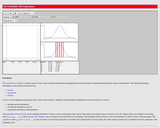
This resource consists of a Java applet and Expository text. The applet …
This resource consists of a Java applet and Expository text. The applet simulates the probability plot that compares the empirical quantiles of a sample from a sampling distribution to the distribution quantiles of a test distribution. The sampling distribution, test distribution, and sample size can be specified.
This lesson is another demonstration of probability and combinations to determine the …
This lesson is another demonstration of probability and combinations to determine the probability of making at least 3 out of 5 basketball free throws. [Probability playlist: Lesson 15 of 29]
A general statistics course, which includes understanding data, measures of central tendency, …
A general statistics course, which includes understanding data, measures of central tendency, measures of variation, binomial distributions, normal distributions, correlation and regression, probability and sampling distributions, Central Limit Theorem, confidence intervals, estimates of population parameters and hypothesis testing. Interpretation and data analysis are emphasized. PREREQUISITES: A grade of C or better in MAT 100 (Intermediate Algebra) or MAT 120 (Math Modeling for Liberal Arts) and placement above or successful completion of ENG 060 (Preparations for College Reading III). A student needs a thorough knowledge of Algebra, good reading skills and familiarity with the graphing calculator before entering this course.
Students will extend their understanding of probability by continuing to conduct experiments …
Students will extend their understanding of probability by continuing to conduct experiments with outcomes that do not have a theoretical probability. They will make predictions on the number of outcomes from a series of trials, and compare their predictions with the experimental probability calculated from an experiment.Key ConceptsStudents continue to investigate the Law of Large Numbers.Goals and Learning ObjectivesDeepen understanding of experimental probability.Use proportions to predict results for a number of trials and to calculate experimental probability.Understand that some events do not have theoretical probability.Understand that there are often many factors involved in determining probability (e.g., human error, randomness).
No restrictions on your remixing, redistributing, or making derivative works. Give credit to the author, as required.
Your remixing, redistributing, or making derivatives works comes with some restrictions, including how it is shared.
Your redistributing comes with some restrictions. Do not remix or make derivative works.
Most restrictive license type. Prohibits most uses, sharing, and any changes.
Copyrighted materials, available under Fair Use and the TEACH Act for US-based educators, or other custom arrangements. Go to the resource provider to see their individual restrictions.