Data management planning is the starting point in the data life cycle. …
Data management planning is the starting point in the data life cycle. Creating a formal document that outlines what you will do with the data during and after the completion of research helps to ensure that the data is safe for current and future use. This lesson describes the benefits of a data management plan (DMP), outlines the components of a DMP, details tools for creating a DMP, provides NSF DMP information, and demonstrates the use of an example DMP.
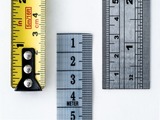
This lesson presents an overview of the various measuring devices used in …
This lesson presents an overview of the various measuring devices used in the agricultural mechanics industry. Students will practice using several measuring devices to take measurements in the agriculture mechanics laboratory.
Because the campuses of the University of Kansas and the University of …
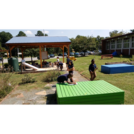
Because the campuses of the University of Kansas and the University of Houston are almost directly on a N-S line we can duplicate many aspects of the classic measurement of Eratosthenese in determining the circumference of the Earth. We use a web cast (backed up by cell phones) to communicate between the two campuses in real time. We measure the shadow of a 2 m stick in both locations at the same time and then go through the math required to calculate the size of the planet.
(Note: this resource was added to OER Commons as part of a batch upload of over 2,200 records. If you notice an issue with the quality of the metadata, please let us know by using the 'report' button and we will flag it for consideration.)
In this lesson, students are given criteria about measures of center, and …
In this lesson, students are given criteria about measures of center, and they must create line plots for data that meet the criteria. Students also explore the effect on the median and the mean when values are added to a data set.Students use a tool that shows a line plot where measures of center are shown. Students manipulate the graph and observe how the measures are affected. Students explore how well each measure describes the data and discover that the mean is affected more by extreme values than the mode or median. The mathematical definitions for measures of center and spread are formalized.Key ConceptsStudents use the Line Plot with Stats interactive to develop a greater understanding of the measures of center. Here are a few of the things students may discover:The mean and the median do not have to be data points.The mean is affected by extreme values, while the median is not.Adding values above the mean increases the mean. Adding values below the mean decreases the mean.You can add values above and below the mean without changing the mean, as long as those points are “balanced.”Adding values above the median may or may not increase the median. Adding values below the median may or may not decrease the median.Adding equal numbers of points above and below the median does not change the median.The measures of center can be related in any number of ways. For example, the mean can be greater than the median, the median can be greater than the mean, and the mode can be greater than or less than either of these measures.Note: In other courses, students will learn that a set of data may have more than one mode. That will not be the case in this lesson.Goals and Learning ObjectivesExplore how changing the data in a line plot affects the measures of center (mean, median).Understand that the mean is affected by outliers more than the median is.Create line plots that fit criteria for given measures of center.
This book seeks to provide students with a deep understanding of the …
This book seeks to provide students with a deep understanding of the definitions, examples, theorems, and proofs related to measure, integration, and real analysis. The content and level of this book fit well with the first-year graduate course on these topics at most American universities. This textbook features a reader-friendly style and format that will appeal to today's students.
The goal of this exercise is to use triangulation to investigate bias …
The goal of this exercise is to use triangulation to investigate bias and measurement validity in parents/teachers evaluations of student health and learning.
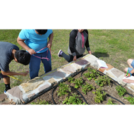
Students will observe and record real-time weather measurements. Students will summarize important …
Students will observe and record real-time weather measurements. Students will summarize important information and use written communication skills to inform and report.
The main aim of this lesson is to show students that distances …
The main aim of this lesson is to show students that distances may be determined without a meter stick—a concept fundamental to such measurements in astronomy. It introduces students to the main concepts behind the first rung of what astronomers call the distance ladder. The four main learning objectives are the following: 1) Explore, in practice, a means of measuring distances without what we most often consider the “direct” means: a meter stick; 2) Understand the limits of a method through the exploration of uncertainties; 3) Understand in the particular method used, the relationship between baseline and the accuracy of the measurement; and 4) Understand the astronomical applications and implications of the method and its limits. Students should be able to use trigonometry and know the relation between trigonometric functions and the triangle. A knowledge of derivatives is also needed to obtain the expression for the uncertainty on the distance measured. Students will need cardboard cut into disks. The number of disks is essentially equal to half the students in the class. Two straight drink straws and one pin per disk. Students will also need a protractor. The lesson should not take more than 50 minutes to complete if the students have the mathematical ability mentioned above. This lesson is complimentary to the BLOSSOMS lesson, "The Parallax Activity." The two lessons could be used sequentially - this one being more advanced - or they could be used separately.
Chemistry is the study of matter. Our understanding of chemical processes thus …
Chemistry is the study of matter. Our understanding of chemical processes thus depends on our ability to acquire accurate information about matter. Often, this information is quantitative, in the form of measurements. In this lab, you will be introduced to some common measuring devices, and learn how to use them to obtain correct measurements, each with correct precision. A metric ruler will be used to measure length in centimeters (cm).
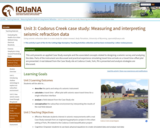
This unit presents an applied Case Study example and the associated concepts …
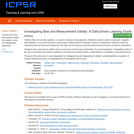
This unit presents an applied Case Study example and the associated concepts related to designing a seismic survey and analyzing the data. Parts of the instrument are discussed and practical experience simulating travel time arrivals on a travel time-offset plot are presented. A real dataset from the Case Study site at Codorus Creek, York, PA is presented and analysis strategies are discussed.
(Note: this resource was added to OER Commons as part of a batch upload of over 2,200 records. If you notice an issue with the quality of the metadata, please let us know by using the 'report' button and we will flag it for consideration.)
This is a video clip of 1 min 36 seconds showing how …
This is a video clip of 1 min 36 seconds showing how to measure noise levels at a work place. You may use this video if you teach in occupational health about how to measure noise.
This is a lab activity that allows students to collect data to …
This is a lab activity that allows students to collect data to practice using effective measurement. While other authors have produced similar labs, this version includes uncertainty analysis consistent with effective measurement technique as presented in the module Measurement and Uncertainty.
This lesson introduces undergraduates to personal digital archiving (PDA) as an instructional …
This lesson introduces undergraduates to personal digital archiving (PDA) as an instructional bridge to research data management.
PDA is the study of how people organize, maintain, use and share personal digital information in their daily lives. PDA skills closely parallel research data management skills, with the added benefit of being directly relevant to undergraduate students, most of whom manage complex personal digital content on a daily basis.
By teaching PDA, librarians encourage authentic learning experiences that immediately resonate with students' day-to-day activities. Teaching PDA builds a foundation of knowledge that not only helps students manage their personal digital materials, but can be translated into research data management skills that will enhance students' academic and professional careers.
This lesson is designed to teach students to measure angles with a …
This lesson is designed to teach students to measure angles with a protractor. The student will be taught how to read the protractor correctly by using either the top or bottom set of numbers. The lesson will reinforce classifying angles as acute, right, and obtuse. The student will sketch angles given a specified measure. This lesson results from the ALEX Resource Gap Project.
Understanding the types, processes, and frameworks of workflows and analyses is helpful …
Understanding the types, processes, and frameworks of workflows and analyses is helpful for researchers seeking to understand more about research, how it was created, and what it may be used for. This lesson uses a subset of data analysis types to introduce reproducibility, iterative analysis, documentation, provenance and different types of processes. Described in more detail are the benefits of documenting and establishing informal (conceptual) and formal (executable) workflows.
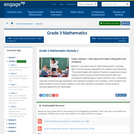
Module 2 uses place value to unify measurement, rounding skills, and the …
Module 2 uses place value to unify measurement, rounding skills, and the standard algorithms for addition and subtraction. The module begins with plenty of hands-on experience using a variety of tools to build practical measurement skills and conceptual understanding of metric and time units. Estimation naturally surfaces through application; this transitions students into rounding. In the modules final topics students round to assess whether or not their solutions to problems solved using the standard algorithms are reasonable.
Find the rest of the EngageNY Mathematics resources at https://archive.org/details/engageny-mathematics.
How big and how old is the universe? This culminating telescope investigation …
How big and how old is the universe? This culminating telescope investigation for high school students has them first taking images of galaxies near and far; then measuring and calculating their distances; then predicting how they might expect galaxies to be moving based on various models of gravity; and then comparing their results with the galaxy velocity measurements in a NASA database. From this data, students explore the concept of an expanding universe and can actually determine an estimate for the age of our universe. This activity is part of a DVD that is a professional development resource for educators. Many new astronomy learners, students and adults alike, are unfamiliar with the universe beyond the solar system. Instructions for obtaining the DVD and registering for the professional development workshop are contained on the website.
No restrictions on your remixing, redistributing, or making derivative works. Give credit to the author, as required.
Your remixing, redistributing, or making derivatives works comes with some restrictions, including how it is shared.
Your redistributing comes with some restrictions. Do not remix or make derivative works.
Most restrictive license type. Prohibits most uses, sharing, and any changes.
Copyrighted materials, available under Fair Use and the TEACH Act for US-based educators, or other custom arrangements. Go to the resource provider to see their individual restrictions.