Updating search results...

Search Resources

512 Results

View
Selected filters:
Science Bulletins
Read the Fine Print
Rating
0.0 stars

This Website brings current science to the general public, informal learning centers, and classrooms. The three Science Bulletins -- Astro, Earth, and Bio - present ongoing research and recent discoveries in astrophysics, Earth science, and biodiversity. Each bulletin has three types of stories: features, data visualizations, and weekly news snapshots. The Astro Bulletins weekly update includes a sequence of current images of the Sun provided by NASA. The video and editorial crew follows scientists into the field to capture original video material and interview scientists about their work-in-progress for the feature stories, which are presented as high-definition videos for informal learning centers and as rich-media collections on the Web. Data visualizations, presented in high-resolution for informal learning centers and in interactive formats on the Web, are based on satellite data sets from NASA, NOAA, and other sources for Earth and Bio; while AstroViz draws from the Museum's Digital Universe project, a growing three-dimensional map/database of celestial objects which has been developed with NASA support to enable science visualizations for research and education purposes. A free Educator's guide and learning activities tailored to the changing content are provided for the Science Bulletins web site.

Subject:
Geoscience
Life Science
Physical Science
Space Science
Provider:
NASA
Provider Set:
NASA Wavelength
Date Added:
11/05/2014
Select-A-City for Demographic and Economic Opportunities, Using an Online Database
Conditional Remix & Share Permitted
CC BY-NC-SA
Rating
0.0 stars

This activity asks students to review the demographic and lifestyle statistics available at ERsys.com, and determine which city or location would provide the best consumer market opportunity for the given problem.

Subject:
Business and Communication
Economics
Social Science
Sociology
Material Type:
Activity/Lab
Provider:
Science Education Resource Center (SERC) at Carleton College
Provider Set:
Starting Point (SERC)
Author:
Michelle Kunz
Date Added:
08/28/2012
Selective Media Virtual Lab
Unrestricted Use
CC BY
Rating
0.0 stars

This is a selective media lab that has been remixed to incorporate a virtual lab. I will add stock photos of "results" soon that can be used for the data analysis portion.

Subject:
Biology
Material Type:
Activity/Lab
Author:
Karla Fuller
Date Added:
05/20/2020
Seminar in Ethnography and Fieldwork
Conditional Remix & Share Permitted
CC BY-NC-SA
Rating
0.0 stars

This advanced course in anthropology engages closely with discussions and debates about ethnographic research, ethics, and representation.

Subject:
Anthropology
Arts and Humanities
Philosophy
Social Science
Material Type:
Full Course
Provider:
MIT
Provider Set:
MIT OpenCourseWare
Author:
Helmreich, Stefan
Date Added:
02/01/2008
Sensors and Scatterplots
Read the Fine Print
Educational Use
Rating
0.0 stars

Students are introduced to several types of common medical sensor devices, such as ear and forehead thermometers, glucometers and wrist blood pressure monitors; they use the latter to measure their blood pressure and pulse rates. Students also measure their heights and weights in order to calculate their BMIs (body mass index). Then they use the collected data to create and analyze scatterplots of the different variables to determine if any relationships exist between the measured variables. Discussions about the trends observed and possible health concerns conclude the activity.

Subject:
Applied Science
Education
Engineering
Material Type:
Activity/Lab
Provider:
TeachEngineering
Provider Set:
TeachEngineering
Author:
Elma M. Piñon
Mounir Ben Ghalia
Date Added:
10/14/2015
Sequence-stratigraphic and mass-balance analysis of experimental stratigraphy
Conditional Remix & Share Permitted
CC BY-NC-SA
Rating
0.0 stars

Sequence-stratigraphic and mass-balance analysis of experimental stratigraphy. Students are charged with evaluating how basin subsidence geometry influences depositional patterns. In addition to providing practice applying sequence-stratigraphic methods, this project builds quantitative data-analysis and writing skills.

Subject:
Geology
Physical Science
Material Type:
Activity/Lab
Homework/Assignment
Provider:
Science Education Resource Center (SERC) at Carleton College
Provider Set:
Teach the Earth
Author:
Liz Hajek
Date Added:
01/20/2023
Simulating the Bug
Read the Fine Print
Educational Use
Rating
0.0 stars

Students modify a provided App Inventor code to design their own diseases. This serves as the evolution step in the software/systems design process. The activity is essentially a mini design cycle in which students are challenged to design a solution to the modification, implement and test it using different population patterns The result of this process is an evolution of the original app.

Subject:
Applied Science
Computer Science
Engineering
Material Type:
Activity/Lab
Provider:
TeachEngineering
Provider Set:
TeachEngineering
Author:
Douglas Bertelsen
Date Added:
09/18/2014
Social Data Analysis
Conditional Remix & Share Permitted
CC BY-NC-SA
Rating
0.0 stars

Qualitative and Quantitative Approaches

Word Count: 137942

(Note: This resource's metadata has been created automatically by reformatting and/or combining the information that the author initially provided as part of a bulk import process.)

Subject:
Applied Science
Computer Science
Information Science
Mathematics
Social Science
Sociology
Statistics and Probability
Material Type:
Textbook
Author:
Roger Clark
Date Added:
08/14/2023
Social Science Workshop Overview
Unrestricted Use
CC BY
Rating
0.0 stars

Workshop overview for the Data Carpentry Social Sciences curriculum. Data Carpentry’s aim is to teach researchers basic concepts, skills, and tools for working with data so that they can get more done in less time, and with less pain. This workshop teaches data management and analysis for social science research including best practices for data organization in spreadsheets, reproducible data cleaning with OpenRefine, and data analysis and visualization in R. This curriculum is designed to be taught over two full days of instruction. Materials for teaching data analysis and visualization in Python and extraction of information from relational databases using SQL are in development. Interested in teaching these materials? We have an onboarding video and accompanying slides available to prepare Instructors to teach these lessons. After watching this video, please contact team@carpentries.org so that we can record your status as an onboarded Instructor. Instructors who have completed onboarding will be given priority status for teaching at centrally-organized Data Carpentry Social Sciences workshops.

Subject:
Applied Science
Information Science
Mathematics
Measurement and Data
Social Science
Material Type:
Module
Provider:
The Carpentries
Author:
Angela Li
Erin Alison Becker
Francois Michonneau
Maneesha Sane
Sarah Brown
Tracy Teal
Date Added:
08/07/2020
Social World Sensing via Social Image Analysis from Social Media
Only Sharing Permitted
CC BY-NC-ND
Rating
0.0 stars

Short Description:
This work explores seven topics from various subject areas (global public health, environmentalism, human rights, political expression, and human predation) through social imagery and data from social media.

Long Description:
Social imagery, the visuals shared by users via various platforms and applications, may be analyzed to elicit something of massmind (and individual) thinking. This work involves the exploration of seven topics from various subject areas (global public health, environmentalism, human rights, political expression, and human predation) through social imagery and data from social media. The coding techniques involve manual coding, the integration of multiple social data streams, computational text analysis, data visualizations, and other combinations of approaches.

Word Count: 101772

(Note: This resource's metadata has been created automatically by reformatting and/or combining the information that the author initially provided as part of a bulk import process.)

Subject:
Arts and Humanities
Business and Communication
Communication
Performing Arts
Material Type:
Textbook
Provider:
New Prairie Press
Author:
Shalin Hai-Jew
Date Added:
04/15/2020
Spatial Database Management and Advanced Geographic Information Systems
Conditional Remix & Share Permitted
CC BY-NC-SA
Rating
0.0 stars

This semester long subject (11.521) is divided into two halves. The first half focuses on learning spatial database management techniques and methods and the second half focuses on using these skills to address a 'real world,' client-oriented planning problem. The first half of the semester may be taken separately using the class number 11.523 and the second half may be taken separately as 11.524.
In order to help shape and utilize the information infrastructure that will support the management and development of our metropolitan areas, planners need a basic understanding of the tools and technology for querying, analyzing, and sharing complex databases and maps. Managing online access to large and constantly-changing spatial datasets can be a powerful aid to planning and can facilitate inter-agency cooperation and collaboration in an increasingly decentralized world. But it requires the use of knowledge representation methods, client-server technologies and access control issues that are quite different from what are needed to model and visualize standalone datasets on a personal computer. Hence, planners should acquire basic skills in database management, digital spatial data analysis, and networking.
The 11.523 portion of the semester addresses these issues while retaining a focus on planning (rather than on computer science). This is an intensive, hands-on class that stresses learning by doing. Exercises and examples involving real-world data, maps, and images are used to develop skills with database query languages and the design development and use of structured databases. Class work utilizes web tools, GIS, and database software with lab exercises primarily on the new high-performance PC computing cluster. Specifically, we will access an Oracle 8i database using SQL (structured query language) and use ArcView for GIS. Each week there are two sixty to ninety-minute classes plus another 90+ minute hands-on lab in electronic classrooms. Class lectures will focus on concepts and case discussion, the scheduled lab time focuses on computer mechanics and skill building. Specific topics during 11.523 include:

finding, understanding and structuring digital spatial data that are available on the Internet using various browsing, visualization, and data management tools;
considerable work with relational database technologies and the Structured Query Language (SQL) to design, construct, query, and update urban planning databases;
some experience with so-called 'client/server' and 'enterprise GIS' technologies for facilitating distributed access to complex spatial data and urban planning applications;
advanced GIS topics such as 3D visualizations and geospatial web services.

The 11.524 portion of the semester will treat the classroom like a professional planning office, working as a team to produce a two deliverables for their client, Lawrence Community Works, Inc. (LCW), a community development corporation located in the City of Lawrence, Massachusetts. LCW and DUSP recently agreed to work together for the next five years to design and implement a multi-tier web-based planning system that promotes democratic involvement and informs community development projects. Your involvement this semester is critical, because the implementation plan that you craft this semester will serve as the road map for both organizations for years to come and the simple web-based planning tool that you design will engage stakeholders by giving them a better sense of how technologies can aid decision-making processes. To assist you with the more technical aspects of the project, we hired Robert Cheetham, President of Azavea, Inc. (http://www.azavea.com/ ), to provide exactly 100 hours of consultancy services. Through their project work, students will enhance important professional skills by:

formulating an implementation plan for a real client;
designing a simple web-based tool for understanding problems;
engaging constituents and stakeholders in a real setting;
integrating theory and practice by evaluating the role of technology in community development;
learning to communicate effectively within a group and with a professional consultant;
working with such tools as the WWW, Access, ArcView, ArcIMS, SDE, etc.

Subject:
Applied Science
Business and Communication
Computer Science
Engineering
Social Science
Sociology
Material Type:
Full Course
Provider:
MIT
Provider Set:
MIT OpenCourseWare
Author:
Ferreira, Joseph
Hoyt, Lorlene
Date Added:
02/01/2003
Spatial and Temporal Tracer Test Data Analysis
Conditional Remix & Share Permitted
CC BY-NC-SA
Rating
0.0 stars

This is an assignment I worked on with Dr. Brusseau (University of Arizona) for his Contaminant Transport class. In this problem solving exercise, students are provided data sets that could be obtained by monitoring flow and transport of a tracer or contaminant in the field or in a soil column experiment in the laboratory. They will need to input the equations into a spreadsheet to complete the assignment.

(Note: this resource was added to OER Commons as part of a batch upload of over 2,200 records. If you notice an issue with the quality of the metadata, please let us know by using the 'report' button and we will flag it for consideration.)

Subject:
Career and Technical Education
Chemistry
Environmental Studies
Hydrology
Physical Science
Material Type:
Lesson Plan
Provider:
Science Education Resource Center (SERC) at Carleton College
Provider Set:
Teach the Earth
Author:
Kenneth Carroll
Date Added:
08/06/2019
Spherical Projections
Conditional Remix & Share Permitted
CC BY-NC-SA
Rating
0.0 stars

This is a sequence of two labs on spherical projections and orientation data analysis. The first lab in the semester introduces data formats for lines and planes (strike, dip, trend, plunge, etc.). Spherical geometry is emphasized and projections and terms are defined. Students solve basic problems using Schmidt nets. The second lab, later in the semester, uses the computer program Orient to examine properties of projections and learn advanced concepts such as eigenvectors, data rotation, contouring, and importing of graphs to Adobe Illustrator, LibreOffice, MS Word, and other programs for presentation.

(Note: this resource was added to OER Commons as part of a batch upload of over 2,200 records. If you notice an issue with the quality of the metadata, please let us know by using the 'report' button and we will flag it for consideration.)

Subject:
Biology
Life Science
Mathematics
Measurement and Data
Material Type:
Activity/Lab
Provider:
Science Education Resource Center (SERC) at Carleton College
Provider Set:
Teach the Earth
Author:
Frederick Vollmer
Date Added:
09/01/2019
The Squares Game
Read the Fine Print
Educational Use
Rating
0.0 stars

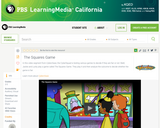
In this video segment from Cyberchase, the CyberSquad determines the fairness of a game in which there are three shapes distributed equally on nine squares.

Subject:
Mathematics
Material Type:
Lesson
Provider:
PBS LearningMedia
Provider Set:
PBS Learning Media Common Core Collection
Author:
U.S. Department of Education
WNET
Date Added:
07/24/2008
Statistical Analysis of Flexible Circuits
Read the Fine Print
Educational Use
Rating
0.0 stars

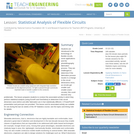
Students are introduced to the technology of flexible circuits, some applications and the photolithography fabrication process. They are challenged to determine if the fabrication process results in a change in the circuit dimensions since, as circuits get smaller and smaller (nano-circuits), this could become very problematic. The lesson prepares students to conduct the associated activity in which they perform statistical analysis (using Excel® and GeoGebra) to determine if the circuit dimension sizes before and after fabrication are in fact statistically different. A PowerPoint® presentation and post-quiz are provided. This lesson and its associated activity are suitable for use during the last six weeks of the AP Statistics course; see the topics and timing note for details.

Subject:
Mathematics
Statistics and Probability
Material Type:
Lesson
Provider:
TeachEngineering
Provider Set:
TeachEngineering
Author:
Cunjiang Yu
Miguel R. Ramirez
Minwei Xu
Song Chen
Date Added:
02/17/2017
Statistical Analysis of Methods to Repair Cracked Steel
Read the Fine Print
Educational Use
Rating
0.0 stars

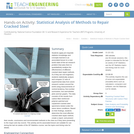
Students apply pre-requisite statistics knowledge and concepts learned in an associated lesson to a real-world state-of-the-art research problem that asks them to quantitatively analyze the effectiveness of different cracked steel repair methods. As if they are civil engineers, students statistically analyze and compare 12 sets of experimental data from seven research centers around the world using measurements of central tendency, five-number summaries, box-and-whisker plots and bar graphs. The data consists of the results from carbon-fiber-reinforced polymer patched and unpatched cracked steel specimens tested under the same stress conditions. Based on their findings, students determine the most effective cracked steel repair method, create a report, and present their results, conclusions and recommended methods to the class as if they were presenting to the mayor and city council. This activity and its associated lesson are suitable for use during the last six weeks of the AP Statistics course; see the topics and timing note for details.

Subject:
Mathematics
Statistics and Probability
Material Type:
Activity/Lab
Provider:
TeachEngineering
Provider Set:
TeachEngineering
Author:
Botong Zheng
Miguel R. Ramirez
Mina Dawood
Date Added:
02/17/2017
Statistical Analysis of Temperature Sensors
Read the Fine Print
Educational Use
Rating
0.0 stars

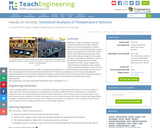
Working as if they are engineers aiming to analyze and then improve data collection devices for precision agriculture, students determine how accurate temperature sensors are by comparing them to each other. Teams record soil temperature data during a class period while making changes to the samples to mimic real-world crop conditions—such as the addition of water and heat and the removal of the heat. Groups analyze their collected data by finding the mean, median, mode, and standard deviation. Then, the class combines all the team data points in order to compare data collected from numerous devices and analyze the accuracy of their recording devices by finding the standard deviation of temperature readings at each minute. By averaging the standard deviations of each minute’s temperature reading, students determine the accuracy of their temperature sensors. Students present their findings and conclusions, including making recommendations for temperature sensor improvements.

Subject:
Mathematics
Statistics and Probability
Material Type:
Activity/Lab
Provider:
TeachEngineering
Provider Set:
Activities
Author:
Keith Lehman
Northern Cass
Trent Kosel
Date Added:
06/28/2017
Statistical Thinking and Data Analysis
Conditional Remix & Share Permitted
CC BY-NC-SA
Rating
0.0 stars

This course is an introduction to statistical data analysis. Topics are chosen from applied probability, sampling, estimation, hypothesis testing, linear regression, analysis of variance, categorical data analysis, and nonparametric statistics.

Subject:
Applied Science
Computer Science
Engineering
Mathematics
Statistics and Probability
Material Type:
Full Course
Provider:
MIT
Provider Set:
MIT OpenCourseWare
Author:
Bisias, Dimitrios
Chang, Allison
Rudin, Cynthia
Date Added:
09/01/2011
Statistics
Unrestricted Use
CC BY
Rating
0.0 stars

A general statistics course, which includes understanding data, measures of central tendency, measures of variation, binomial distributions, normal distributions, correlation and regression, probability and sampling distributions, Central Limit Theorem, confidence intervals, estimates of population parameters and hypothesis testing.  Interpretation and data analysis are emphasized. PREREQUISITES: A grade of C or better in MAT 100 (Intermediate Algebra) or MAT 120 (Math Modeling for Liberal Arts) and placement above or successful completion of ENG 060 (Preparations for College Reading III).  A student needs a thorough knowledge of Algebra, good reading skills and familiarity with the graphing calculator before entering this course.

Subject:
Statistics and Probability
Material Type:
Module
Author:
Jordana Shaw
Date Added:
05/15/2019
Statistics
Unrestricted Use
CC BY
Rating
0.0 stars

A general statistics course, which includes understanding data, measures of central tendency, measures of variation, binomial distributions, normal distributions, correlation and regression, probability and sampling distributions, Central Limit Theorem, confidence intervals, estimates of population parameters and hypothesis testing. Interpretation and data analysis are emphasized.

Subject:
Mathematics
Statistics and Probability
Material Type:
Full Course
Provider:
Middlesex Community College
Author:
Sanford Arbogast
Date Added:
05/13/2019