This set of assignments exposes students to statistics and data pertaining to …
This set of assignments exposes students to statistics and data pertaining to economic wellbeing over time across racial (black-white) categories in the U.S.
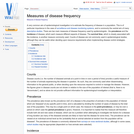
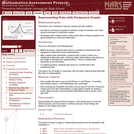
A very common aim of epidemiological investigation is to estimate the frequency …
A very common aim of epidemiological investigation is to estimate the frequency of disease in a population. This is of particular importance in the case of surveillance and disease monitoring systems, and is commonly the central aim of many descriptive studies. There are two main measures of disease frequency used by epidemiologists - the prevalence and the incidence of disease, which each measure different aspects of disease. The survival time, which is closely associated with the incidence, is another measure commonly used. Counts of disease are not commonly used in epidemiological studies, although they can be useful when deciding upon resource requirements when implementing disease control strategies.
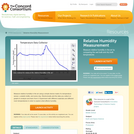
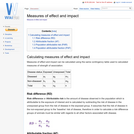
Measure relative humidity in the air using a simple device made of …
Measure relative humidity in the air using a simple device made of a temperature sensor, a plastic bottle, and some clay. Electronically plot the data you collect on graphs to analyze and learn from it. Experiment with different materials and different room temperatures in order to explore what affects humidity.
This activity is a lab investigation where students gather data about the …
This activity is a lab investigation where students gather data about the masses of various solid objects found in a classroom. The students graph their data, compare their data, and draw conclusions about what kinds of materials contain more matter than others.
When entering data, common goals include creating data sets that are valid, …
When entering data, common goals include creating data sets that are valid, have gone through an established process to ensure quality, are organized, and reusable. This lesson outlines best practices for creating data files. It will detail options for data entry and integration, and provide examples of processes used for data cleaning, organization and manipulation.
Data curation primers are peer-reviewed, living documents to provide practical and concise …
Data curation primers are peer-reviewed, living documents to provide practical and concise guides on curating a specific data type or format, or addressing a particular challenge in data curation work. All the primers are developed by Data Curation Network (DCN) which is a seed funding project from the Alfred P Sloan Foundation. The target audiences of primers are data curators and/or data librarians. To date, DCN has published more than 25 primers on database, Excel, netCDF, NVivo, R, SPSS, etc.
This lesson plan is designed to be used in a middle school …
This lesson plan is designed to be used in a middle school family and consumer science classroom. The focus of the lesson is on measuring in cooking, culinary, foods, and labs courses using effective math strategies.
Students estimate the length of 20 seconds by starting an unseen timer …
Students estimate the length of 20 seconds by starting an unseen timer and stopping it when they think 20 seconds has elapsed. They are shown the results and repeat the process two more times. The first and third times are recorded and compiled, producing two data sets to be compared. Students analyze the data to conclude whether or not their ability to estimate 20 seconds improves with practice.Key ConceptsMeasures of center and spreadLine plots, box plots, and histogramsMean absolute deviation (MAD)Goals and Learning ObjectivesApply knowledge of statistics to compare sets of data.Use measures of center and spread to analyze data.Decide which graph is appropriate for a given situation.
Students collect data to answer questions about a typical sixth grade student. …
Students collect data to answer questions about a typical sixth grade student. Students collect data about themselves, working in pairs to measure height, arm span, etc. Students discuss characteristics they would like to know about sixth grade students, adding these topics to a preset list. Data are collected and organized such that there is a class data set for each topic for future use. Students are asked to think about how this data could be represented and organized.Key ConceptsFor data to be useful, it must be collected in a consistent and accurate way. For example, for height data, students must agree on whether students should be measured with shoes on or off, and whether heights should be measured to the nearest inch, half inch, or centimeter.Goals and Learning ObjectivesGather data about sixth grade students.Consider how data are collected.
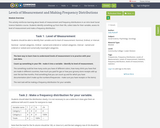
This activity reinforces learning about levels of measurement and frequency distributions in …
This activity reinforces learning about levels of measurement and frequency distributions in an intro level Social Science Statistics course. Students identify something up from their life, collect data for their variable, assess its level of measurement and make a frequency distribution.
Data management planning is the starting point in the data life cycle. …
Data management planning is the starting point in the data life cycle. Creating a formal document that outlines what you will do with the data during and after the completion of research helps to ensure that the data is safe for current and future use. This lesson describes the benefits of a data management plan (DMP), outlines the components of a DMP, details tools for creating a DMP, provides NSF DMP information, and demonstrates the use of an example DMP.
As rapidly changing technology enables researchers to collect large, complex datasets with …
As rapidly changing technology enables researchers to collect large, complex datasets with relative ease, the need to effectively manage these data increases in kind. This is the first lesson in a series of education modules intended to provide a broad overview of various topics related to research data management. It covers: trends in data collection, storage and loss, the importance and benefits of data management, and an introduction to the data life cycle.
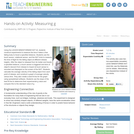
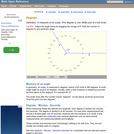
Using the LEGO MINDSTORMS(TM) NXT kit, students construct experiments to measure the …
Using the LEGO MINDSTORMS(TM) NXT kit, students construct experiments to measure the time it takes a free falling body to travel a specified distance. Students use the touch sensor, rotational sensor, and the NXT brick to measure the time of flight for the falling object at different release heights. After the object is released from its holder and travels a specified distance, a touch sensor is triggered and time of object's descent from release to impact at touch sensor is recorded and displayed on the screen of the NXT. Students calculate the average velocity of the falling object from each point of release, and construct a graph of average velocity versus time. They also create a best fit line for the graph using spreadsheet software. Students use the slope of the best fit line to determine their experimental g value and compare this to the standard value of g.
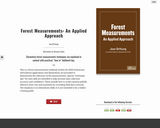
An Applied Approach Short Description: This is a forest measurements textbook written …
An Applied Approach
Short Description: This is a forest measurements textbook written for field technicians. Silvicultural applications and illustrations are provided to demonstrate the relevance of the measurements. Special “technique tips” for each skill are intended to help increase data collection accuracy and confidence. These include how to avoid common pitfalls, effective short cuts and essentials for recording field data correctly. The emphasis is on elementary skills; it is not intended to be a timber cruising guide. Order a print copy: http://www.lulu.com/content/paperback-book/forest-measurements-an-applied-approach/23678305
Long Description: This is a forest measurements textbook written for field technicians. Silvicultural applications and illustrations are provided to demonstrate the relevance of the measurements. Special “technique tips” for each skill are intended to help increase data collection accuracy and confidence. These include how to avoid common pitfalls, effective short cuts and essentials for recording field data correctly. Topics include how to determine %slope, tree height, tree diameter, live crown ratio, tree age, crown class and site index. The emphasis is on elementary skills; it is not intended to be a timber cruising guide.
Order a print copy: http://www.lulu.com/content/paperback-book/forest-measurements-an-applied-approach/23678305
Word Count: 21980
ISBN: 978-1-63635-053-0
(Note: This resource's metadata has been created automatically by reformatting and/or combining the information that the author initially provided as part of a bulk import process.)
Student teams build model hand dynamometers used to measure grip strengths of …
Student teams build model hand dynamometers used to measure grip strengths of people recovering from sports injuries. They use their models to measure how much force their classmates muscles are capable of producing, and analyze the data to determine factors that influence a person's grip strength. They use this information to produce a recommendation of a hand dynamometer design for a medical office specializing in physical therapy. They also consider the many other ways grip strength data is used by engineers to design everyday products.
This lesson unit is intended to help teachers assess how well students: …
This lesson unit is intended to help teachers assess how well students: are able to use frequency graphs to identify a range of measures and make sense of this data in a real-world context; and understand that a large number of data points allow a frequency graph to be approximated by a continuous distribution.
This model-eliciting activity challenges students to operationally define a construct (study effectiveness). …
This model-eliciting activity challenges students to operationally define a construct (study effectiveness). Students are given a survey to review that rates different aspects of study behaviors. They are then given a set of data for a few students and asked to use their scores to determine an index of study effectiveness. After determining a method, they are then asked to use this index to put five students in rank order according to their scores on study effectiveness. Students write a report explaining the method they used to determine these scores and how they produced their ratings.
Students will begin to think about probability by considering how likely it …
Students will begin to think about probability by considering how likely it is that their house will be struck by lightning. They will consider the relative likelihood of familiar events (e.g., outdoor temperature, test scores) on the continuum between impossible and certain. Students will discuss where on the continuum "likely," "unlikely," and "equally likely as unlikely" areGoals and Learning ObjectivesThink about the concept of likelihood.Understand that probability is a measure of likelihood.Informally estimate the likelihood of certain events.Begin to think about why one event is more likely than another.SWD: Students with disabilities may need additional support seeing the relationships among problems and strategies. Throughout this unit, keep anchor charts available and visible to assist them in making connections and working toward mastery. Provide explicit think alouds comparing strategies and making connections. In addition, ask probing questions to get students to articulate how a peer solved the problem or how one strategy or visual representation is connected or related to another.
An interactive applet that acts as a 'digital manipulative' for explaining angles …
An interactive applet that acts as a 'digital manipulative' for explaining angles measured in degrees. The applet has an angle formed from two segment that can be dragged around in a circle. The angle measure is shown against a 'clock face' calibrated in degrees. The measures can be turned off for class angle estimation discussions. Applet can be enlarged to full screen size for use with a classroom projector. This resource is a component of the Math Open Reference Interactive Geometry textbook project at http://www.mathopenref.com.
No restrictions on your remixing, redistributing, or making derivative works. Give credit to the author, as required.
Your remixing, redistributing, or making derivatives works comes with some restrictions, including how it is shared.
Your redistributing comes with some restrictions. Do not remix or make derivative works.
Most restrictive license type. Prohibits most uses, sharing, and any changes.
Copyrighted materials, available under Fair Use and the TEACH Act for US-based educators, or other custom arrangements. Go to the resource provider to see their individual restrictions.