Students will use images, U.S. Census Bureau data, and interactive maps to …
Students will use images, U.S. Census Bureau data, and interactive maps to visualize and calculate arithmetic (population), agricultural, and physiological densities at local, regional, and national scales. They will also transfer their calculations to bar graphs.
Students act as R&D entrepreneurs, learning ways to research variables affecting the …
Students act as R&D entrepreneurs, learning ways to research variables affecting the market of their proposed (hypothetical) products. They learn how to obtain numeric data using a variety of Internet tools and resources, sort and analyze the data using Excel and other software, and discover patterns and relationships that influence and guide decisions related to launching their products. First, student pairs research and collect pertinent consumer data, importing the data into spreadsheets. Then they clean, organize, chart and analyze the data to inform their product production and marketing plans. They calculate related statistics and gain proficiency in obtaining and finding relationships between variables, which is important in the work of engineers as well as for general technical literacy and decision-making. They summarize their work by suggesting product launch strategies and reporting their findings and conclusions in class presentations. A finding data tips handout, project/presentation grading rubric and alternative self-guided activity worksheet are provided. This activity is ideal for a high school statistics class.
Short Description: The book includes details on how to analyze public-use data …
Short Description: The book includes details on how to analyze public-use data from five common national health surveys using SAS statistical software. It is an essential resource for future epidemiologists and other public health professionals!
Long Description: National data sets provide an avenue for students to practice data analytic skills while also answering meaningful research questions. This open education resource was developed to train future public health professionals how to conduct secondary data analysis of national health surveys using SAS statistical software. SAS software was selected because it is one of the most commonly used software programs used among public health departments and academia. The book includes details on how to analyze public-use data from five common national health surveys, including the National Health Interview Survey (NHIS), Medical Expenditure Panel Survey (MEPS), Health Information National Trends Survey (HINTS), Behavior Risk Factor Surveillance System (BRFSS) and National Health and Nutrition and Examination Survey (NHANES). All datasets and corresponding syntax files are available from the Open ICPSR Data Repository.
Word Count: 43537
ISBN: 978-1-64816-003-5
(Note: This resource's metadata has been created automatically by reformatting and/or combining the information that the author initially provided as part of a bulk import process.)
This set of interactive data visualizations show the weather and climate events …
This set of interactive data visualizations show the weather and climate events that have had the greatest economic impact on the US from 1980 to 2016.
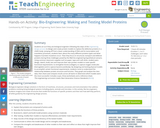
Students act as if they are biological engineers following the steps of …
Students act as if they are biological engineers following the steps of the engineering design process to design and create protein models to replace the defective proteins in a child’s body. Jumping off from a basic understanding of DNA and its transcription and translation processes, students learn about the many different proteins types and what happens if protein mutations occur. Then they focus on structural, transport and defense proteins during three challenges posed by the R&D; bio-engineering hypothetical scenario. Using common classroom supplies such as paper, tape and craft sticks, student pairs design, sketch, build, test and improve their own protein models to meet specific functional requirements: to strengthen bones (collagen), to capture oxygen molecules (hemoglobin) and to capture bacteria (antibody). By designing and testing physical models to accomplish certain functional requirements, students come to understand the relationship between protein structure and function. They graph and analyze the class data, then share and compare results across all teams to determine which models were the most successful. Includes a quiz, three worksheets and a reference sheet.
This course is a continuation of Bioinformatics I. Topics include gene expression, …
This course is a continuation of Bioinformatics I. Topics include gene expression, microarrays, next- generation sequencing methods, RNA-seq, large genomic projects, protein structure and stability, protein folding, and computational structure prediction of proteins; proteomics; and protein-nucleic acid interactions. The lab component includes R-based statistical data analysis on large datasets, introduction to big data analysis tools, protein visualization software, internet-based tools and high-level programming languages.
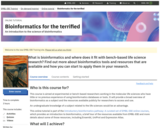
What is bioinformatics and where does it fit with bench-based life science …
What is bioinformatics and where does it fit with bench-based life science research? Find out more about bioinformatics tools and resources that are available and how you can start to apply them in your research.
By the end of the course you will be able to: Assess the role of bioinformatics in molecular science. Describe the key features of primary and secondary databases. List strategies for describing data consistently. Identify some of the different types of data analysis that can be applied to solving biological problems.
The aim of this course is to provide fundamental statistical concepts and …
The aim of this course is to provide fundamental statistical concepts and tools relevant to the practice of summarizing, analyzing, and visualizing data. This course will build your knowledge of the fundamental principles of biostatistical inference. The course will focus on linear regression and generalized linear regression models. We will use a variety of examples and exercises from scientific, medical, and public health research.
In Bootstrap:Data Science, students form their own questions about the world around …
In Bootstrap:Data Science, students form their own questions about the world around them, analyze data using multiple methods, and write a research paper about their findings. The module covers functions, looping and iteration, data visualization, linear regression, and more. Social studies, science, and business teachers can utilize this module to help students make inferences from data. Math teachers can use this module to introduce foundational concepts in statistics, and it is aligned to state and national standards.
This book is used in Reach Higher, Oklahoma's adult degree completion program, …
This book is used in Reach Higher, Oklahoma's adult degree completion program, for a course called Data Analysis & Interpretation. It provides basic statistics that can be used for organizational data analysis by individuals with managerial professional goals, while also teaching essential skills from Microsoft Excel commonly needed for data analysis. This book uses material from Lumen Learning's Boundless Statistics (Boundless Learning) and Excel for Decision Making from University of Houston Libraries (multiple authors).
Breathing Easier is a 5th-grade curricular program created by EarthGen. For this …
Breathing Easier is a 5th-grade curricular program created by EarthGen. For this unit, we offer professional development training and assistance with implementation. If you are interested in implementing this program at your school or district, please let us know! Please contact info@earthgenwa.org for more information.EarthGen and Puget Sound Clean Air Agency have partnered to develop opportunities for learning about local air quality (AQ). Using interactive maps, multimedia resources, classroom discussions, community science, and data analysis, students will explore the causes of air pollution and its relationship to environmental justice. These lessons are aligned with the Next Generation Science Standards and encourage students to engage in argumentation from evidence and propose solutions to socio-ecological issues of air quality and public health for communities in Washington.
The field of infancy research faces a difficult challenge: some questions require …
The field of infancy research faces a difficult challenge: some questions require samples that are simply too large for any one lab to recruit and test. ManyBabies aims to address this problem by forming large-scale collaborations on key theoretical questions in developmental science, while promoting the uptake of Open Science practices. Here, we look back on the first project completed under the ManyBabies umbrella – ManyBabies 1 – which tested the development of infant-directed speech preference. Our goal is to share the lessons learned over the course of the project and to articulate our vision for the role of large-scale collaborations in the field. First, we consider the decisions made in scaling up experimental research for a collaboration involving 100+ researchers and 70+ labs. Next, we discuss successes and challenges over the course of the project, including: protocol design and implementation, data analysis, organizational structures and collaborative workflows, securing funding, and encouraging broad participation in the project. Finally, we discuss the benefits we see both in ongoing ManyBabies projects and in future large-scale collaborations in general, with a particular eye towards developing best practices and increasing growth and diversity in infancy research and psychological science in general. Throughout the paper, we include first-hand narrative experiences, in order to illustrate the perspectives of researchers playing different roles within the project. While this project focused on the unique challenges of infant research, many of the insights we gained can be applied to large-scale collaborations across the broader field of psychology.
This problem-based learning module is designed to master the Ohio Learning standard …
This problem-based learning module is designed to master the Ohio Learning standard of Science in Earth and Space Science number 2, Cycles and Patterns of Earth and the Moon. Thermal-energy transfers in the ocean and the atmosphere contribute to the formation of currents, which influence global climate patterns. Students will be exploring the various factors affecting the climate patterns we experience due to thermal energy. Students will work independently as well as with a partner. The final product is expected to be presented to their peers and teachers. This blended module includes teacher-led instruction, student-led stations, real world data analysis and technology integrated investigations.
Short Description: The content of this textbook is aligned with the British …
Short Description: The content of this textbook is aligned with the British Columbia Adult Basic Education learning outcomes for the Advanced Level Business/Technical Mathematics. The textbook covers nine groups of learning outcomes organized in chapters. The first three chapters cover the core learning outcomes: 1. Operations with Real Numbers, 2. First Degree Equations and Inequalities, 3. Equations and their Graphs. The remaining chapters cover the following six topics: 4. Systems of Equations, 5. Trigonometry, 6. Health Option, 7. Finance, 8. Data Analysis 1, 9. Data Analysis 2.
Word Count: 137676
ISBN: 978-1-77420-126-8
(Note: This resource's metadata has been created automatically by reformatting and/or combining the information that the author initially provided as part of a bulk import process.)
Submitted as part of the California Learning Resource Network (CLRN) Phase 3 …
Submitted as part of the California Learning Resource Network (CLRN) Phase 3 Digital Textbook Initiative (CA DTI3), CK-12 Advanced Probability and Statistics introduces students to basic topics in statistics and probability but finishes with the rigorous topics an advanced placement course requires. Includes visualizations of data, introduction to probability, discrete probability distribution, normal distribution, planning and conducting a study, sampling distributions, hypothesis testing, regression and correlation, Chi-Square, analysis of variance, and non-parametric statistics.
This resource is a video abstract of a research paper created by …
This resource is a video abstract of a research paper created by Research Square on behalf of its authors. It provides a synopsis that's easy to understand, and can be used to introduce the topics it covers to students, researchers, and the general public. The video's transcript is also provided in full, with a portion provided below for preview:
"Microbiomes are more than just prokaryotes and viruses; they also contain important eukaryotes, including fungi and protists. However, eukaryotes are difficult to study using ‘shotgun’ metagenomics, as their signal is often overwhelmed by the prokaryotes. Some methods use eukaryote-specific marker genes, but they can’t detect eukaryotes that aren’t in the reference marker gene set, and such methods are not compatible with web-based tools for downstream analysis. But CORRAL (Clustering Of Related Reference ALignments) is designed to close those gaps. CORRAL identifies eukaryotes in metagenomic data based on alignments to eukaryote-specific marker genes and Markov clustering. It can detect microbial eukaryotes that are not included in the marker gene reference set. The process is even automated and can be carried out at scale. A recent paper demonstrates CORRAL’s sensitivity and accuracy with simulated datasets, mock community standards, and human microbiome datasets..."
The rest of the transcript, along with a link to the research itself, is available on the resource itself.
This lesson asks students to consider carefully the assumptions they make when …
This lesson asks students to consider carefully the assumptions they make when interpreting data and data visualizations. The class begins by examining how the Google Flu Trends project tried and failed to use search trends to predict flu outbreaks. They will then read a report on the Digital Divide which highlights how access to technology differs widely by personal characteristics like race and income. This report challenges a widespread assumption that data collected online is representative of the population at large. To practice identifying assumptions in data analysis, students are provided a series of scenarios in which data-driven decisions are made based on flawed assumptions. They will need to identify the assumptions being made (most notably those related to the digital divide) and explain why these assumptions lead to incorrect conclusions.
This is a pretty fun lesson that has two main parts. First …
This is a pretty fun lesson that has two main parts. First students warm up by reflecting on the reasons data visualizations are used to communicate about data. This leads to the main activity in which students look at some collections of (mostly bad) data visualizations, rate them, explain why a good one is effective, and also suggest a fix for a bad one.
In the second part of class students compare their experiences and create a class list of common faults and best practices for creating data visualizations. Finally, students review and read the first few pages of **Data Visualization 101: How to design charts and graphs** to see some basic principles of good data visualizations and see how they compare with the list the class came up with.
Now that students have had the chance to see and evaluate various …
Now that students have had the chance to see and evaluate various data visualizations, they will learn to make visualizations of their own. This lesson teaches students how to build visualizations from provided datasets. The levels in Code Studio provide a detailed walkthrough of how to use Google Sheets to create several different kinds of charts. While this lesson focuses on the Google Sheets tool, other tools may be substituted at the teacher’s discretion, and MS Excel support is coming soon to the lesson.
The main activity teaches students to build different chart types (scatter, line, and bar charts) from a single data set. It should be emphasized to students that the purpose of this lesson is to explore and experiment with creating different types of visualizations, not to build the perfect chart. Students will have a chance to create and customize their own charts. At the end of class, students compare their custom visualizations with those of their classmates.
In this lesson, students will collaboratively investigate some datasets and use visualization …
In this lesson, students will collaboratively investigate some datasets and use visualization tools to “discover a data story.” The lesson assumes that students know how to use some kind of visualization tool - in the previous lesson we used the charting tools of a basic spreadsheet program. Students should be working with a partner but without much teacher hand-holding. Most of the time should be spent with students poking around the data and trying to discover connections and trends using data visualization tools. It is up to them to discover a trend, make a chart, and accurately write about it.
No restrictions on your remixing, redistributing, or making derivative works. Give credit to the author, as required.
Your remixing, redistributing, or making derivatives works comes with some restrictions, including how it is shared.
Your redistributing comes with some restrictions. Do not remix or make derivative works.
Most restrictive license type. Prohibits most uses, sharing, and any changes.
Copyrighted materials, available under Fair Use and the TEACH Act for US-based educators, or other custom arrangements. Go to the resource provider to see their individual restrictions.