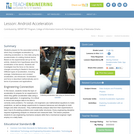
Students will explore maps containing census data from 1950 through 2000. They …
Students will explore maps containing census data from 1950 through 2000. They will analyze how education levels and median household incomes have changed over time and determine how the two might be correlated. Students will also come up with ideas for policies that could help address issues related to income and education.
Students conducted data analysis about American political divisions and created two papers …
Students conducted data analysis about American political divisions and created two papers from this data analysis. Sutdents were assigned to group projects involving data analysis assigned chapters in MICROCASE AMERICAN GOVERNMENT, a textbook that includes access to a variety of datasets.
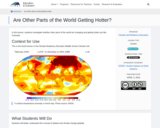
The webinar features Dr. Joshua Rosenberg from the University of Tennessee, Knoxville …
The webinar features Dr. Joshua Rosenberg from the University of Tennessee, Knoxville and Dr. Cynthia D’Angelo from the University of Illinois at Urbana-Champaign discussing best practices examples for using R. They will present: a) general strategies for using R to analyze educational data and b) accessing and using data on the Open Science Framework (OSF) with R via the osfr package. This session is for those both new to R and those with R experience looking to learn more about strategies and workflows that can help to make it possible to analyze data in a more transparent, reliable, and trustworthy way.
This workshop demonstrates how using R can advance open science practices in …
This workshop demonstrates how using R can advance open science practices in education. We focus on R and RStudio because it is an increasingly widely-used programming language and software environment for data analysis with a large supportive community. We present: a) general strategies for using R to analyze educational data and b) accessing and using data on the Open Science Framework (OSF) with R via the osfr package. This session is for those both new to R and those with R experience looking to learn more about strategies and workflows that can help to make it possible to analyze data in a more transparent, reliable, and trustworthy way. Access the workshop slides and supplemental information at https://osf.io/vtcak/.
Resources:
1) Download R: https://www.r-project.org/ 2) Download RStudio (a tool that makes R easier to use): https://rstudio.com/products/rstudio/... 3) R for Data Science (a free, digital book about how to do data science with R): https://r4ds.had.co.nz/ 4) Tidyverse R packages for data science: https://www.tidyverse.org/ 5) RMarkdown from RStudio (including info about R Notebooks): https://rmarkdown.rstudio.com/ 6) Data Science in Education Using R: https://datascienceineducation.com/
Intermediate students are asked to analyze data on the components of consumption …
Intermediate students are asked to analyze data on the components of consumption and investment expenditures and explanatory variables based on textbook models of each. Students look for rough correlations between the explanatory and dependent variables.
Students prepare for the associated activity in which they investigate acceleration by …
Students prepare for the associated activity in which they investigate acceleration by collecting acceleration vs. time data using the accelerometer of a sliding Android device. Based on the experimental set-up for the activity, students form hypotheses about the acceleration of the device. Students will investigate how the force on the device changes according to Newton's Second Law. Different types of acceleration, including average, instantaneous and constant acceleration, are introduced. Acceleration and force is described mathematically and in terms of processes and applications.
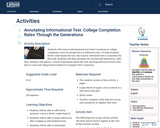
Students will read an informational text about variations in college completion rates …
Students will read an informational text about variations in college completion rates for people born in different years. To help students better understand the text, the teacher will model how to annotate the first half. Students will then annotate the second half themselves. After that, students will answer a series of questions about the text, drawing inferences from what they’ve read and citing textual evidence to support their responses.
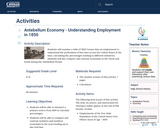
Students will examine a table of 1850 Census data on employment to …
Students will examine a table of 1850 Census data on employment to understand the professions of free men across the United States at the time, calculating the percentages working in different industries. Students will also compare and contrast economies in the North and South during the Antebellum Period.
This lab activity will not only draw on students' real life experiences …
This lab activity will not only draw on students' real life experiences but will also draw on student's previous lab experiences in proper laboratory techniques and data analysis performed in previous activities. The lab will incorporate the use of scientific inquiry methods and strategies while students develop reasonable answers to the questions asked.
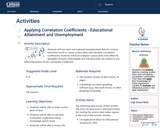
Students will use state and regional unemployment data for various education levels …
Students will use state and regional unemployment data for various education levels to create scatter plots and calculate correlation coefficients. Students will then compare scatter plots with different strengths of linear relationships and will determine the impact of any influential points on the correlation coefficient.
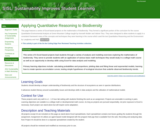
A series of 6 Excel-based projects on the mathematics of biodiversity for …
A series of 6 Excel-based projects on the mathematics of biodiversity for basic college math classes and developmental math classes. Students learn about the structure of biodiversity, the application of many basic data analysis skills, and the use of Excel for analysis and data presentation.
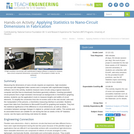
Measuring the dimensions of nano-circuits requires an expensive, high-resolution microscope with integrated …
Measuring the dimensions of nano-circuits requires an expensive, high-resolution microscope with integrated video camera and a computer with sophisticated imaging software, but in this activity, students measure nano-circuits using a typical classroom computer and (the free-to-download) GeoGebra geometry software. Inserting (provided) circuit pictures from a high-resolution microscope as backgrounds in GeoGebra's graphing window, students use the application's tools to measure lengths and widths of circuit elements. To simplify the conversion from the on-screen units to the real circuits' units and the manipulation of the pictures, a GeoGebra measuring interface is provided. Students export their data from GeoGebra to Microsoft® Excel® for graphing and analysis. They test the statistical significance of the difference in circuit dimensions, as well as obtain a correlation between average changes in original vs. printed circuits' widths. This activity and its associated lesson are suitable for use during the last six weeks of the AP Statistics course; see the topics and timing note below for details.
This is an introduction to the classic version of ArcGIS StoryMaps. It …
This is an introduction to the classic version of ArcGIS StoryMaps. It provides a walkthrough of the website functions and has tasks listed for students to build their first story map.
Students investigate the intelligence of dinosaurs by comparing the relative size of …
Students investigate the intelligence of dinosaurs by comparing the relative size of brain and body mass to living animals. Students plot the living animals to determine a general relationship of brain and body mass and then use that relation to interpret a range of dinosaurs. The activity gives students practice in graphical data comparison and other methods of data analysis. Students also investigate how well this method works and what weaknesses it might have.
(Note: this resource was added to OER Commons as part of a batch upload of over 2,200 records. If you notice an issue with the quality of the metadata, please let us know by using the 'report' button and we will flag it for consideration.)
This course introduces students to the basic knowledge representation, problem solving, and …
This course introduces students to the basic knowledge representation, problem solving, and learning methods of artificial intelligence. Upon completion of 6.034, students should be able to develop intelligent systems by assembling solutions to concrete computational problems; understand the role of knowledge representation, problem solving, and learning in intelligent-system engineering; and appreciate the role of problem solving, vision, and language in understanding human intelligence from a computational perspective.
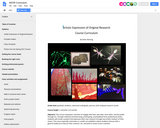
Grade level: graduate students, advanced undergrads, persons with analyzed research results Course …
Grade level: graduate students, advanced undergrads, persons with analyzed research results
Course length: 1 semester, 4-6 months
Objective: This course empowers scientists to engage with their own data, each other, and the public through art. Through collective brainstorming, prototyping, and feedback from professional artists, students will create a project that expresses their own research through any artistic medium of their choice. The course typically culminates in a public art exhibition where students interact with a general audience to discuss their research, art, and what it means to be a scientist.
Bureau of Justice Statistics offers dynamic data analysis tools allows you to …
Bureau of Justice Statistics offers dynamic data analysis tools allows you to generate tables and graphs of arrest, recidivism, federal case processing among other data.
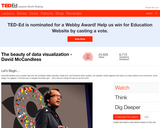
David McCandless turns complex data sets (like worldwide military spending, media buzz, …
David McCandless turns complex data sets (like worldwide military spending, media buzz, Facebook status updates) into beautiful, simple diagrams that tease out unseen patterns and connections. Good design, he suggests, is the best way to navigate information glut -- and it may just change the way we see the world. A quiz, thought provoking question, and links for further study are provided to create a lesson around the 18-minute video. Educators may use the platform to easily "Flip" or create their own lesson for use with their students of any age or level.
No restrictions on your remixing, redistributing, or making derivative works. Give credit to the author, as required.
Your remixing, redistributing, or making derivatives works comes with some restrictions, including how it is shared.
Your redistributing comes with some restrictions. Do not remix or make derivative works.
Most restrictive license type. Prohibits most uses, sharing, and any changes.
Copyrighted materials, available under Fair Use and the TEACH Act for US-based educators, or other custom arrangements. Go to the resource provider to see their individual restrictions.