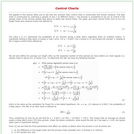
The applets in this section allow you to see how the common …
The applets in this section allow you to see how the common Xbar control chart is constructed with known variance. The Xbar chart is constructed by collecting a sample of size n at different times t.
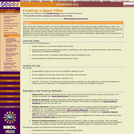
Why study Quantitative Literacy? Most students sign up for this course to …
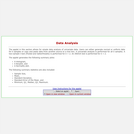
Why study Quantitative Literacy?
Most students sign up for this course to fulfill a general education mathematics requirement. And this text is certainly aimed at that general audience. But by the time the course is completed, the authors hope that you will have developed some appreciation for the usefulness and elegance of the subject. Without doubt, some level of competency and comfort in working with numerical data is needed to navigate the modern world; and we have tried to cover topics that can be used in day to day life.
In this book, we will focus on problem solving and critical thinking skills. Our goal is not to prepare you just for the next math class, but to equip you with the necessary tools so that you can apply basic mathematical reasoning to a wide variety of commonly encountered problems. Along the way, we will learn basic logic, how to work with percentages and units, the basics of consumer finance, and how to use and interpret basic statistical data.
This activity asks students to work in a team to develop a …
This activity asks students to work in a team to develop a set of rules that can be used to program a SPAM filter for a client. The rules are based on characteristics of the subject lines of emails. Students are given samples of SPAM and non-SPAM subject lines to examine. After their rules are ready, they are given a test set of data to use and are asked to come up with a numerical measure to quantify how well their method (model) works. Each team writes a report describing how their model works and how well it performed on the test data. This activity could serve as an introduction to ideas of classification. Alternatively, the activity could be the basis for student introduction to types of statistical errors.
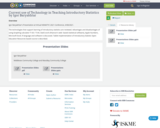
Igor Baryakhtar's Presentation at Virtual NEMATYC 2021 Conference, 4/08/2021.The technologies that support …
Igor Baryakhtar's Presentation at Virtual NEMATYC 2021 Conference, 4/08/2021.The technologies that support learning of introductory statistics are reviewed. Advantages and disadvantages of using Graphing calculator TI 83 / TI 84, StatCrunch (Pearson's web- based statistical software), Apple Numbers, Microsoft Excel, R language and software is discussed. Tablet implementation of Introductory Statistic Open Education Resources based course is described.
With your mouse, drag data points and their error bars, and watch …
With your mouse, drag data points and their error bars, and watch the best-fit polynomial curve update instantly. You choose the type of fit: linear, quadratic, cubic, or quartic. The reduced chi-square statistic shows you when the fit is good. Or you can try to find the best fit by manually adjusting fit parameters.
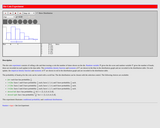
The applet in this section allows for simple data analysis of univariate …
The applet in this section allows for simple data analysis of univariate data. Users can either generate normal or uniform data for k samples or copy and paste data from another source to a text box. A univariate analysis is performed for all k samples.
This page shares five units of youcubed lessons for grades 6-10 that …
This page shares five units of youcubed lessons for grades 6-10 that introduce students (and teachers) to data science. The units start with an introduction to the concept of data and move to lessons that invite students to explore their own data sets. These lessons teach important content through a pattern-seeking, exploratory approach, and are designed to engage students actively.
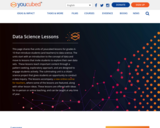
Data Science LessonsThis page shares five units of youcubed lessons for grades 6-10 that introduce students (and teachers) to data science. The units start with an introduction to the concept of data and move to lessons that invite students to explore their own data sets. These lessons teach important content through a pattern-seeking, exploratory approach, and are designed to engage students actively. The culminating unit is a citizen science project that gives students an opportunity to conduct a data inquiry. The lessons accompany a new online course for teachers, where some of the lessons are featured, along with other lesson ideas. These lessons are offered with ideas for in-person or online teaching, and can be taught at any time of year.
LessonsTeacher Online Course: 21st Century Teaching and LearningUnit 1: Data Is EverywhereUnit 2: Working With Data Analysis ToolsUnit 3: Measures of Center & SpreadUnit 4: Understanding VariabilityUnit 5: A Community Data Collection Project
ResourcesHigh School Data Science CourseCODAPWhat's Going On In This Graph?Data Science Initiative VideoThe Data Science K-12 MovementData Talks
This course explores visualization methodologies to conceive and represent systems and data, …
This course explores visualization methodologies to conceive and represent systems and data, e.g., financial, media, economic, political, etc., with a particular focus on climate change data in this version of the course. Topics include basic methods for research, cleaning, and analysis of datasets, and creative methods of data presentation and storytelling. The course considers the emotional, aesthetic, ethical, and practical effects of different presentation methods as well as how to develop metrics for assessing impact. Coursework includes readings, visualization exercises, and a final project.
Data talks are short 5-10 minute classroom discussions to help students develop …
Data talks are short 5-10 minute classroom discussions to help students develop data literacy. This pedagogical strategy is similar in structure to a number talk, but instead of numbers students are shown a data visual and asked what interests them.
The designing, collecting, analyzing, and reporting of psychological studies entail many choices …
The designing, collecting, analyzing, and reporting of psychological studies entail many choices that are often arbitrary. The opportunistic use of these so-called researcher degrees of freedom aimed at obtaining statistically significant results is problematic because it enhances the chances of false positive results and may inflate effect size estimates. In this review article, we present an extensive list of 34 degrees of freedom that researchers have in formulating hypotheses, and in designing, running, analyzing, and reporting of psychological research. The list can be used in research methods education, and as a checklist to assess the quality of preregistrations and to determine the potential for bias due to (arbitrary) choices in unregistered studies.
This course covers the design, construction, and testing of field robotic systems, …
This course covers the design, construction, and testing of field robotic systems, through team projects with each student responsible for a specific subsystem. Projects focus on electronics, instrumentation, and machine elements. Design for operation in uncertain conditions is a focus point, with ocean waves and marine structures as a central theme. Topics include basic statistics, linear systems, Fourier transforms, random processes, spectra, ethics in engineering practice, and extreme events with applications in design.
This resource consists of a Java applet and expository text. The applet …
This resource consists of a Java applet and expository text. The applet simulates the experiment of rolling a die and then tossing a coin the number of times shown on the die. The die distribution and the probability of heads can be specified. The applet illustrates a two-stage experiment.
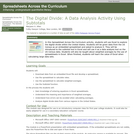
Spreadsheets Across the Curriculum module. Students analyze a given data set to …
Spreadsheets Across the Curriculum module. Students analyze a given data set to understand the "Digital Divide" by means of percentages and the Subtotal tool in Excel.
A review activity for college probability and statistics. Topics include:~Plausible values for population …
A review activity for college probability and statistics. Topics include:~Plausible values for population mean based on a confidence interval~The effects of confidence level on the width/precision of the confidence interval~Notations for sample statistics and population parameters~Comparing p-values to a significance level to make a hypothesis test decision~Evaluating the strength of statistical evidence in a hypothesis test(Thanks to Dr. Justin Grieves, math professor at Charleston Southern University, for providing problems for the activity, the use of his name and picture.)
Spreadsheets Across the Curriculum module. Students use spreadsheets to help find the …
Spreadsheets Across the Curriculum module. Students use spreadsheets to help find the difference in percentages of salaries between dirty and clean jobs.
We have empirically assessed the distribution of published effect sizes and estimated …
We have empirically assessed the distribution of published effect sizes and estimated power by analyzing 26,841 statistical records from 3,801 cognitive neuroscience and psychology papers published recently. The reported median effect size was D = 0.93 (interquartile range: 0.64–1.46) for nominally statistically significant results and D = 0.24 (0.11–0.42) for nonsignificant results. Median power to detect small, medium, and large effects was 0.12, 0.44, and 0.73, reflecting no improvement through the past half-century. This is so because sample sizes have remained small. Assuming similar true effect sizes in both disciplines, power was lower in cognitive neuroscience than in psychology. Journal impact factors negatively correlated with power. Assuming a realistic range of prior probabilities for null hypotheses, false report probability is likely to exceed 50% for the whole literature. In light of our findings, the recently reported low replication success in psychology is realistic, and worse performance may be expected for cognitive neuroscience.
No restrictions on your remixing, redistributing, or making derivative works. Give credit to the author, as required.
Your remixing, redistributing, or making derivatives works comes with some restrictions, including how it is shared.
Your redistributing comes with some restrictions. Do not remix or make derivative works.
Most restrictive license type. Prohibits most uses, sharing, and any changes.
Copyrighted materials, available under Fair Use and the TEACH Act for US-based educators, or other custom arrangements. Go to the resource provider to see their individual restrictions.