In this activity, students will practice kitchen-related vocabulary, and the food preparation …
In this activity, students will practice kitchen-related vocabulary, and the food preparation steps, and then discuss their preference for places they like to eat at.Can-Do Statements:I can describe the food preparation steps.I can look at pictures in the kitchen vocabulary and identify them.I can talk about where I like to eat the most.
Distributions and Variability Type of Unit: Project Prior Knowledge Students should be …
Distributions and Variability
Type of Unit: Project
Prior Knowledge
Students should be able to:
Represent and interpret data using a line plot. Understand other visual representations of data.
Lesson Flow
Students begin the unit by discussing what constitutes a statistical question. In order to answer statistical questions, data must be gathered in a consistent and accurate manner and then analyzed using appropriate tools.
Students learn different tools for analyzing data, including:
Measures of center: mean (average), median, mode Measures of spread: mean absolute deviation, lower and upper extremes, lower and upper quartile, interquartile range Visual representations: line plot, box plot, histogram
These tools are compared and contrasted to better understand the benefits and limitations of each. Analyzing different data sets using these tools will develop an understanding for which ones are the most appropriate to interpret the given data.
To demonstrate their understanding of the concepts, students will work on a project for the duration of the unit. The project will involve identifying an appropriate statistical question, collecting data, analyzing data, and presenting the results. It will serve as the final assessment.
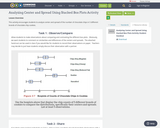
Students will apply what they have learned in previous lessons to analyze …
Students will apply what they have learned in previous lessons to analyze and draw conclusions about a set of data. They will also justify their thinking based on what they know about the measures (e.g., I know the mean is a good number to use to describe what is typical because the range is narrow and so the MAD is low.).Students analyze one of the data sets about the characteristics of sixth grade students that was collected by the class in Lesson 2. Students construct line plots and calculate measures of center and spread in order to further their understanding of the characteristics of a typical sixth grade student.Key ConceptsNo new mathematical ideas are introduced in this lesson. Instead, students apply the skills they have acquired in previous lessons to analyze a data set for one attribute of a sixth grade student. Students make a line plot of the data and find the mean, median, range, MAD, and outliers. They use these results to determine a typical value for their data.Goals and Learning ObjectivesDescribe an attribute of a typical sixth grade student using line plots and measures of center (mean and median) and spread (range and MAD).Justify thinking about which measures are good descriptors of the data set.
No restrictions on your remixing, redistributing, or making derivative works. Give credit to the author, as required.
Your remixing, redistributing, or making derivatives works comes with some restrictions, including how it is shared.
Your redistributing comes with some restrictions. Do not remix or make derivative works.
Most restrictive license type. Prohibits most uses, sharing, and any changes.
Copyrighted materials, available under Fair Use and the TEACH Act for US-based educators, or other custom arrangements. Go to the resource provider to see their individual restrictions.