This resource is a video abstract of a research paper created by …
This resource is a video abstract of a research paper created by Research Square on behalf of its authors. It provides a synopsis that's easy to understand, and can be used to introduce the topics it covers to students, researchers, and the general public. The video's transcript is also provided in full, with a portion provided below for preview:
"This video is based on a preprint. Preprints are preliminary reports that have not undergone peer review. They should not be considered conclusive, used to inform clinical practice, or referenced by the media as validated information. As the COVID-19 pandemic wages on, scientific research is uncovering multiple forces that alter the spread of the disease. One enhancing factor could be air pollution. Researchers at the University of Cambridge recently linked COVID-19 to air pollution levels in England, where more than 45,000 patients have died of COVID-19. Initial findings revealed that regional variations in nitrogen oxide and ozone in particular could predict COVID-19 cases and deaths. The risk of infection was found to be increased by exposure to particulate matter (PM). Such pollution can lead to increased inflammation in the lungs or even help carry the virus that causes COVID-19 across large distances..."
The rest of the transcript, along with a link to the research itself, is available on the resource itself.
Using gumdrops and toothpicks, students conduct a large-group, interactive ozone depletion model. …
Using gumdrops and toothpicks, students conduct a large-group, interactive ozone depletion model. Students explore the dynamic and competing upper atmospheric roles of the protective ozone layer, the sun's UV radiation and harmful human-made CFCs (chlorofluorocarbons).
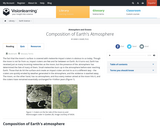
This module explores the composition of the earth's atmosphere, how temperature and …
This module explores the composition of the earth's atmosphere, how temperature and pressure vary in the atmosphere, and the scientific developments that led to an understanding of these basic concepts.
This video segment adapted from Interactive NOVA profiles two scientists who were …
This video segment adapted from Interactive NOVA profiles two scientists who were surprised in 1984 to discover a hole in our atmosphere's ozone layer as big as the United States.
This resource is a video abstract of a research paper created by …
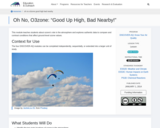
This resource is a video abstract of a research paper created by Research Square on behalf of its authors. It provides a synopsis that's easy to understand, and can be used to introduce the topics it covers to students, researchers, and the general public. The video's transcript is also provided in full, with a portion provided below for preview:
"Ozone is a strong disinfectant known to kill bacteria and viruses. But when pumped into biofiltration systems at low doses ozone seems to have the opposite effect, boosting microbe activity and thus filtration performance all while relieving clogging issues by reducing overall biomass. To find out how ozone improves biofilter performance, researchers examined two toluene-treating biofilters at the microbial level. One served as the control, while the other was exposed to a low dose of ozone. The microbiome of the exposed filter consistently showed 30% higher biodiversity than the control filter with an increased capacity to break down amino and carboxylic acids. In addition, ozonation led to a higher abundance of stress-tolerant and biofilm-forming species causing a shift in the degradation pathways of certain compounds..."
The rest of the transcript, along with a link to the research itself, is available on the resource itself.
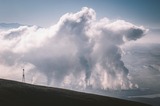
Students develop their understanding of the effects of invisible air pollutants with …
Students develop their understanding of the effects of invisible air pollutants with a rubber band air test, a bean plant experiment and by exploring engineering roles related to air pollution. In an associated literacy activity, students develop visual literacy and write photograph captions. They learn how images are manipulated for a powerful effect and how a photograph can make the invisible (such as pollutants) visible. Note: You may want to set up the activities for Air Pollution unit, Lessons 2 and 3, simultaneously as they require extended data collection time and can share collection sites.
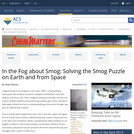
This ChemMatters article provides a brief background on smog, then examines the …
This ChemMatters article provides a brief background on smog, then examines the causes of it, efforts to reduce it, and methods used to measure it. ChemMatters is an educational magazine for high school students.
Learners will identify sources of air pollution, explain the greenhouse effect, and …
Learners will identify sources of air pollution, explain the greenhouse effect, and detail procedures for improving and maintaining air quality. This represents a portion of the Introduction to Agriculture, Food, and Natural Resources (AFNR) series in Nebraska middle and high school agricultural education.
The goal of this activity is for students to learn how to …
The goal of this activity is for students to learn how to tell a story in order to make a complex topic (such as global warming or ozone holes) easier for a reader to grasp. Students realize that the narrative impulse underlies even scientific and technical writing and gain a better understanding of the role of myth as a "science" of imagination that helps us to gain insight into human motivation.
Students explore the causes and effects of the Earth's ozone holes through …
Students explore the causes and effects of the Earth's ozone holes through discussion and an interactive simulation. In an associated literacy activity, students learn how to tell a story in order to make a complex topic (such as global warming or ozone holes) easier for a reader to grasp.
This module teaches students about ozone’s role in the atmosphere and explores …
This module teaches students about ozone’s role in the atmosphere and explores authentic data to compare and contrast conditions that affect ground-level ozone values.
During the first kinetics lecture, we traced the efforts of atmospheric chemists …
During the first kinetics lecture, we traced the efforts of atmospheric chemists to explain the depletion of ozone in the upper atmosphere. (The powerpoint slides have been posted on Blackboard for your review.) U2 spy planes gathered much of the initial data that linked ClO in the stratosphere to the ozone depletion. The data collected during these flights showed the concentrations of various chemical species in the stratosphere, but did not measure how fast the processes were occurring. To determine the kinetics (rates) of ozone depletion reactions, chemists perform controlled laboratory studies. In this homework, we will interpret data obtained from such laboratory experiments to study the ozone depletion reaction.
This resource is a video abstract of a research paper created by …
This resource is a video abstract of a research paper created by Research Square on behalf of its authors. It provides a synopsis that's easy to understand, and can be used to introduce the topics it covers to students, researchers, and the general public. The video's transcript is also provided in full, with a portion provided below for preview:
"New research finds that female mice are most vulnerable to air pollution early in their reproductive cycle That finding calls for a closer look at menstrual cycle phase when studying air pollution effects in women Researchers gathered mice at two different stages of their reproductive cycle marked by clear differences in circulating sex hormones They then exposed each group to ozone, a reactive air pollutant known to worsen symptoms of lung disease Those in the earlier phase showed higher activation of the immune system, suggesting higher sensitivity to air pollution at that time The carryover to women hasn’t yet been explored But the overall message is clear Women’s hormonal status should always be recorded in studies on air pollution and lung inflammation Fuentes et al. "Modulation of the lung inflammatory response to ozone by the estrous cycle..."
The rest of the transcript, along with a link to the research itself, is available on the resource itself.
These learning activities are designed to be used in a large introductory …
These learning activities are designed to be used in a large introductory chemistry course, each as part of a larger module of learning activities that include a prior reading of a short background information document. By working in small groups to discuss the presented information and question prompts, students will apply concepts seen in earlier coursework to explore a topic of societal or environmental relevance. No new conceptual information is delivered in these activities; rather they provide an opportunity to show students how the chemistry concepts they have developed support a detailed scientific understanding of a significant issue.Instructional resources for each activity include 1) background information (.docx and .pdf) 2) the learning activity (.docx and .pdf) 3) the learning objects (.docx and .pdf) and 4) the slide deck (.pptx).These activities include exploration of:Methyl Transferase EnzymesNitrogen CycleOzone and Chlorofluorocarbons Mechanism of Penicillin Interior Salish Pit Cooking
Students determine their carbon footprints by answering questions about their everyday lifestyle …
Students determine their carbon footprints by answering questions about their everyday lifestyle choices. Then they engineer plans to reduce them. Students learn about their personal impacts on global climate change and how they can help the environment.
No restrictions on your remixing, redistributing, or making derivative works. Give credit to the author, as required.
Your remixing, redistributing, or making derivatives works comes with some restrictions, including how it is shared.
Your redistributing comes with some restrictions. Do not remix or make derivative works.
Most restrictive license type. Prohibits most uses, sharing, and any changes.
Copyrighted materials, available under Fair Use and the TEACH Act for US-based educators, or other custom arrangements. Go to the resource provider to see their individual restrictions.