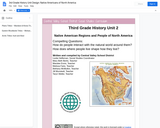
This unit on American Indians: By studying the regions of the United …
This unit on American Indians: By studying the regions of the United States and the cultures that live in each region, students are able to compare/contrast within regions and across regions how tribes used their environments, and their cultural and other contributions to American life.
Note that the emphasis here is on broader groups of tribes for each region with some instruction on specific tribes representing each region. In no way is this case study approach to learning about one tribe meant to be generalized to all tribes of that region. We understand that each tribe was and continues to be unique in its culture, practices, lifeways, and traditions.
Sometime after 1492, the concept of the New World or America came …
Sometime after 1492, the concept of the New World or America came into being, and this concept appeared differently - as an experience or an idea - for different people and in different places. This semester, we will read three groups of texts: first, participant accounts of contact between native Americans and French or English speaking Europeans, both in North America and in the Caribbean and Brazil; second, transformations of these documents into literary works by contemporaries; third, modern texts which take these earlier materials as a point of departure for rethinking the experience and aftermath of contact. The reading will allow us to compare perspectives across time and space, across the cultural geographies of religion, nation and ethnicity, and finally across a range of genres - reports, captivity narratives, essays, novels, poetry, drama, and film. Some of the earlier authors we will read are Michel Montaigne, William Shakespeare, Jean de Léry, Daniel Defoe and Mary Rowlandson; more recent authors include Derek Walcott, and J. M. Coetzee.
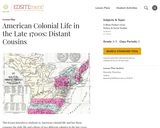
This lesson introduces students to American colonial life and has them compare …
This lesson introduces students to American colonial life and has them compare the daily life and culture of two different colonies in the late 1700s. Students study artifacts of the thirteen original British colonies and write letters between fictitious cousins in Massachusetts and Delaware.
This resource is a video abstract of a research paper created by …
This resource is a video abstract of a research paper created by Research Square on behalf of its authors. It provides a synopsis that's easy to understand, and can be used to introduce the topics it covers to students, researchers, and the general public. The video's transcript is also provided in full, with a portion provided below for preview:
"A recent study shows that common pesticides could seriously harm and disorient a songbird native to North America. Migratory bird populations across the world are declining. While that trend has been linked to a litany of complex factors, one of the most concerning is the widespread use of common pesticides, namely, organophosphates and neonicotinoids. Neonicotinoids, the more modern of the pair, were originally thought to be less harmful to the human and wildlife nervous system. But mounting evidence suggests that may notbe the case. One group of animals susceptible to the brain-altering effects of the pesticides are migratory songbirds. In a recent study, researchers looked at the white-crowned sparrow in particular. The white-crowned sparrow migrates as far as northern Canada during breeding season and as far south as Central Mexico in the winter. Like many other migratory birds, the sparrow relies on the rich farmland in between to rest and refuel. And that’s where danger may lie..."
The rest of the transcript, along with a link to the research itself, is available on the resource itself.
This lesson focuses on comparing and contrasting national governments in North America …
This lesson focuses on comparing and contrasting national governments in North America and/or Central America. It is the second in a sequence, the first being "Comparing Governments - Local, State, and National" by Tami Weaver and Wendy Pineda.
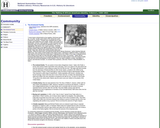
"I never knew a whole family to live together, till all were …
"I never knew a whole family to live together, till all were grown up, in my life," recalls Lewis Clarke of his twenty-five years enslaved in Kentucky.1 Families were separated due to sale, escape, early death from poor health, suicide, and murder by a slaveholder, overseer, slave patroller, or other dominant person. Separation also occurred within the plantation itself, e.g., by segregating "field slaves" from "house servants," removing children from parents to live together with a slave caretaker, or bringing children fathered by the slaveholder to live in the "Big House." How, then, did the slave family provide solace and identity? "What the family does, and what the family did for African Americans," writes historian Deborah White Gray, "was create a world outside of the world of work. It allowed for significant others. It allowed a male slave to be more than just a brute beast. It allowed him to be a father, to be a son. It allowed women to be mothers and to take on roles that were outside of that of a slave, of a servant."2 When did the enslaved child realize how his or her family life differed from the slave-holder's? How did enslaved adults cope with the forced disintegration of their families? Here we read a collection of texts—two letters, a memoir, and interview excerpts—to consider these questions. (See also Theme II: ENSLAVEMENT, #2, Sale.)
This class explores the interrelationship between humans and natural environments. It does …
This class explores the interrelationship between humans and natural environments. It does so by focusing on conflict over access to and use of the environment as well as ideas about "nature" in various parts of the world.
This site looks at Europe's view of North America before and after …
This site looks at Europe's view of North America before and after Columbus, Martin Waldseemuller's 1507 map of the world, Diego Gutierrez's 1562 map of America, Spanish and Portuguese encounters in America, the Dutch in America, exploration and settlement of America from British and American points of view, Lewis and Clark, Henry Hudson, Jacques Cartier, and early images of the U.S.
Global Citizens in Action is a civic engagement curriculum that focuses on …
Global Citizens in Action is a civic engagement curriculum that focuses on cultural exchange, media literacy, and global citizenship. Through exploring the driving question, “How do we, as youth, engage our communities to create positive social change?”
Road to Doha explores critical environmental issues through addressing the driving question …
Road to Doha explores critical environmental issues through addressing the driving question “How do we, as youth, impact climate change in our communities?”
International Women’s Voices has several objectives. It introduces students to a variety …
International Women’s Voices has several objectives. It introduces students to a variety of works by contemporary women writers from Asia, Africa, the Middle East, Latin America and North America. The emphasis is on non-western writers. The readings are chosen to encourage students to think about how each author’s work reflects a distinct cultural heritage and to what extent, if any, we can identify a female voice that transcends national cultures. In lectures and readings distributed in class, students learn about the history and culture of each of the countries these authors represent. The way in which colonialism, religion, nation formation and language influence each writer is a major concern of this course. In addition, students examine the patterns of socialization of women in patriarchal cultures, and how, in the imaginary world, authors resolve or understand the relationship of the characters to love, work, identity, sex roles, marriage, and politics.
This course examines the production, transmission, preservation and qualities of folk music …
This course examines the production, transmission, preservation and qualities of folk music in the British Isles and North America from the 18th century to the folk revival of the 1960s and the present. There is a special emphasis on balladry, fiddle styles, and African-American influences. The class sings ballads and folk songs from the Child and Lomax collections as well as other sources as we examine them from literary, historical, and musical points of view. Readings supply critical and background materials from a number of sources. Visitors and films bring additional perspectives.
This subject investigates the special relation of women to several musical folk …
This subject investigates the special relation of women to several musical folk traditions in the British Isles and North America. Throughout, we will be examining the implications of gender in the creation, transmission, and performance of music. Because virtually all societies operate to some extent on a gendered division of labor (and of expressive roles) the music of these societies is marked by the gendering of musical repertoires, traditions of instrumentation, performance settings, and styles. This seminar will examine the gendered dimensions of the music - the song texts, the performance styles, processes of dissemination (collection, literary representation) and issues of historiography - with respect to selected traditions within the folk musics of North America and the British Isles, with the aim of analyzing the special contributions of women to these traditions. In addition to telling stories about women's musical lives, and studying elements of female identity and subjectivity in song texts and music, we will investigate the ways in which women's work and women's cultural roles have affected the folk traditions of these several countries.
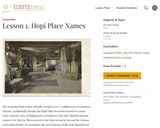
A guided exploration of "Hopitutskwa," the Hopi homeland, through maps and place …
A guided exploration of "Hopitutskwa," the Hopi homeland, through maps and place names. Using English translations, students make inferences about the Hopi cultural relationship to landscape and place. They examine regional place names of their own home communities and create personal maps by identifying and naming places of importance in their lives.
Map shows census divisions (a variably sized region ranging from 1100 and …
Map shows census divisions (a variably sized region ranging from 1100 and 2.5 million people) color coded by the percentage of people living in the area that lived in a different province or territory five years ago. CDs in sparsely populated regions are excluded. The map suggests that there is a great deal of migration into Alberta -- likely to work in the oil industry.
This course offers an analysis of the keen interest shown by France …
This course offers an analysis of the keen interest shown by France and the French in North American cultures since the eighteenth century. Not only did France contribute to the construction of both Canadian and American nations but also it has constantly delineated its identity by way of praising or criticizing North American cultures. Taught in French.
In this curriculum unit, students will learn about the origins of four …
In this curriculum unit, students will learn about the origins of four major types of British surnames. They will consult lists to discover the meanings of specific names and later demonstrate their knowledge of surnames through various group activities. They will then compare the origins of British to certain types of non-British surnames. In a final activity, the students will research the origins and meanings of their own family names.
No restrictions on your remixing, redistributing, or making derivative works. Give credit to the author, as required.
Your remixing, redistributing, or making derivatives works comes with some restrictions, including how it is shared.
Your redistributing comes with some restrictions. Do not remix or make derivative works.
Most restrictive license type. Prohibits most uses, sharing, and any changes.
Copyrighted materials, available under Fair Use and the TEACH Act for US-based educators, or other custom arrangements. Go to the resource provider to see their individual restrictions.