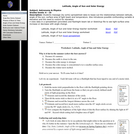
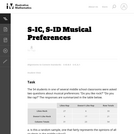
"Pre" extension - The first extension creates programming to ask the user …
"Pre" extension - The first extension creates programming to ask the user for values that are needed to figure out the frequency of individuals showing the recessive trait. This is THE one number needed to calculate all the other frequencies. The frequency of individuals showing the recessive trait is the only one that can be observed in a population BUT it is not always given in the word problem. "Post" extension - The second will take the frequencies and apply them to an actual population number to generate actual numbers of individuals of the 3 genotypes and numbers of each allele … in that population.
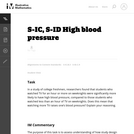
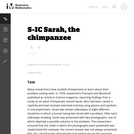
The purpose of this task is to assess understanding of how study …
The purpose of this task is to assess understanding of how study design dictates whether a conclusion of causation is warranted. This study was observational and not an experiment, which means that it is not possible to reach a cause-and-effect conclusion.
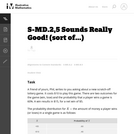
From this original story, young readers and listeners learn about four tools …
From this original story, young readers and listeners learn about four tools scientists use to study climate - climate stations, weather balloons, satellites, and buoys. The story is available at two reading levels and in three formats - text-only, illustrated booklet, and electronic book. Glossary included. Each issue of Beyond Weather and the Water Cycle contains an original story that expands on the theme.
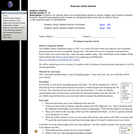
This task is designed as an assessment item. It requires students to …
This task is designed as an assessment item. It requires students to use information in a two-way table to calculate a probability and a conditional probability. Although the item is written in multiple choice format, the answer choices could be omitted to create a short-answer task.
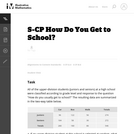
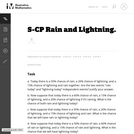
Students massage (by sorts) spreadsheet data to tease out the relationships between …
Students massage (by sorts) spreadsheet data to tease out the relationships between latitude, angle of the sun, surface area of light beam and temperature. Also introduces possible confounding variable of elevation and the need to control for elevation. • Uses data in a spreadsheet (provided) and flashlight beam lab or Sketchup file to see light surface area increase or decrease with angle change.
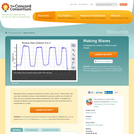
Repeated motion is present everywhere in nature. Learn how to 'make waves' …
Repeated motion is present everywhere in nature. Learn how to 'make waves' with your own movements using a motion detector to plot your position as a function of time, and try to duplicate wave patterns presented in the activity. Investigate the concept of distance versus time graphs and see how your own movement can be represented on a graph.
This task provides a context to calculate discrete probabilities and represent them …
This task provides a context to calculate discrete probabilities and represent them on a bar graph. It could also be used to create a class activity where students gather, represent, and analyze data, running simulations of the random walk and recording and then displaying their results.
This task completes the line of reasoning of Random Walk III in …
This task completes the line of reasoning of Random Walk III in a situation where the numbers become too large to calculate and so abstract reasoning is required in order to compare the different probabilities. It is intended for instructional purposes only with a goal of understanding how to calculate and compare the combinatorial symbols.
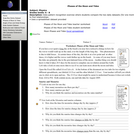
The purpose of this task is to give students experience in using …
The purpose of this task is to give students experience in using simulation to determine if observed results are consistent with a given model (in this case, the Ňjust guessingÓ model). Part (i) also addresses the role of random assignment in the design of an experiment and assesses understanding of this concept.
This task involves two aspects of statistical reasoning: providing a probabilistic model …
This task involves two aspects of statistical reasoning: providing a probabilistic model for the situation at hand, and defining a way to collect data to determine whether or not the observed data is reasonably likely to occur under the chosen model. When guessing between two choices, there is no reason to suspect that one outcome is more likely than the other. Thus, a model that assumes the two outcomes to be equally likely (such as flipping a coin) is appropriate.
The purpose of this task is to have students complete normal distribution …
The purpose of this task is to have students complete normal distribution calculations and to use properties of normal distributions to draw conclusions. The task is designed to encourage students to communicate their findings in a narrative/report form in context Đ not just simply as a computed number.
The purpose of this task is to have students compute and interpret …
The purpose of this task is to have students compute and interpret an expected value, and then use the information provided by the expected value to make a decision. The task is designed to encourage students to communicate their findings in a non-technical form in context.
Students roll vehicles down and inclined plane placed at various heights and …
Students roll vehicles down and inclined plane placed at various heights and measure distance traveled. Recorded and graphed data reveals an unexpected data trend (due to friction force).
No restrictions on your remixing, redistributing, or making derivative works. Give credit to the author, as required.
Your remixing, redistributing, or making derivatives works comes with some restrictions, including how it is shared.
Your redistributing comes with some restrictions. Do not remix or make derivative works.
Most restrictive license type. Prohibits most uses, sharing, and any changes.
Copyrighted materials, available under Fair Use and the TEACH Act for US-based educators, or other custom arrangements. Go to the resource provider to see their individual restrictions.