Updating search results...

Search Resources

23 Results

View
Selected filters:
  • human-geography
Air Quality and Environmental Justice (Air Quality #4)
Conditional Remix & Share Permitted
CC BY-NC
Rating
0.0 stars

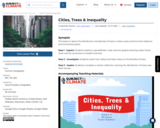
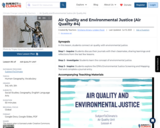
SYNOPSIS: In this lesson, students connect air quality with environmental justice.

SCIENTIST NOTES: This lesson introduces the relationship between environment and justice. Students understand if their community is healthy and what to do to create a fair, just, equitable, and sustainable planet for all to thrive. Additional materials are suitable to broaden their understanding on a wide range of topics such as segregation, the connection between climate and justice, racial justice, and social justice. All materials in this lesson are properly cited and are void of scientific contradictions. In this light, this lesson has passed our science credibility process.

POSITIVES:
-This lesson allows students to create their own meaning of environmental justice before viewing the explanatory video.
-The EPA's Environmental Justice Screening and Mapping Tool is amazing. Students will love it.

ADDITIONAL PREREQUISITES:
-The video explaining environmental justice might be tough for 3rd-5th graders to understand. Students should understand the core message in the video, even if they might not understand all the details.

DIFFERENTIATION:
-Some students may want more time to explore the EPA's Environmental Justice Screening and Mapping Tool.
-The reflection journal at the end of the lesson has options for student creativity and imagination.

Subject:
English Language Arts
Physical Geography
Physical Science
Material Type:
Lesson Plan
Provider:
SubjectToClimate
Author:
Emiliano Amaro
Lindsey Pockl
Date Added:
06/24/2023
Cities, Trees & Inequality
Conditional Remix & Share Permitted
CC BY-NC
Rating
0.0 stars

SYNOPSIS: This lesson is about the distribution and density of trees in urban areas and how that relates to environmental justice.

SCIENTIST NOTES: This lesson uses data from peer-reviewed research that breaks down the forest cover in cities as it correlates to income. The evidence is clear and convincing that more affluent neighborhoods have more tree cover, which has a documented benefit on the residents. All external links are scientifically sound, and this lesson has pass our science quality assessment.

POSITIVES:
-This is an engaging lesson because it is so personal. Students will think about tree cover where they live and how that relates to demographic data.
-Students will practice their data analysis skills.

ADDITIONAL PREREQUISITES:
-It is necessary to share the Student Slideshow with your students and give them editing access before beginning the lesson. All students will be writing in the same slideshow.
-The videos list the benefits of trees pretty quickly. It might be hard for students to type fast enough to keep up. You could play the videos at 0.9 speed or replay parts of the videos as necessary.
-The following is a list of benefits of trees. Students will create a similar list while they are watching the two videos outlining the benefits of trees.

-Reduce nearby outside temperatures
-Reduce amount of energy used for heating and cooling buildings
-Absorb carbon dioxide, thus mitigating climate change
-Filter urban pollutants and fine particulates
-Provide habitat, food, and protection to plants and animals
-Provide food for people
-Increase biodiversity
-Provide wood that can be used at the end of a tree’s life
-Improve physical and mental health of people
-Increase property values
-Create oxygen
-Provide shade for people and animals
-Control stormwater runoff, protecting water quality and reducing the need for water treatment
-Protect against mudslides
-Help prevent floods
-Improve air quality
-Increase attention spans and decrease stress levels in people
-Improve health outcomes in hospital patients

DIFFERENTIATION:
-Teachers can use the glossary at the end of the slideshow at any point throughout the lesson to help students understand vocabulary.

-The spreadsheet and the graph on slide 11 might be tricky. Encourage your students to turn and talk to one another for help.

-Many students will not have a good understanding of Celsius. Easy reminder: Multiply the temperature in Celsius by 1.8 to get degrees Fahrenheit. Example: 2.5°C x 1.8 = 4.5°F (The temperature difference between poorest and richest census blocks in Milwaukee, Wisconsin.)

Subject:
Physical Geography
Physical Science
Social Science
Material Type:
Lesson Plan
Provider:
SubjectToClimate
Author:
Dan Castrigano
Date Added:
06/28/2023
Constructing a Model of ppbv of Surface Ozone
Read the Fine Print
Educational Use
Rating
0.0 stars

The purpose of this activity is to construct a model that will provide students with a visual representation of parts per billion. Students work in teams to construct cubes of different volumes and to compare them to get a feel for parts per million by volume and parts per billion by volume. The intended outcome is that students gain a feeling for the small quantities of gases, such as ozone, present in the Earth's atmosphere.

Subject:
Atmospheric Science
Physical Science
Material Type:
Activity/Lab
Interactive
Lesson Plan
Provider:
UCAR Staff
Provider Set:
GLOBE Teacher's Guide
Author:
The GLOBE Program, UCAR (University Corporation for Atmospheric Research)
Date Added:
08/01/2003
Cultural Intelligence
Conditional Remix & Share Permitted
CC BY-NC-SA
Rating
0.0 stars

GEOG 571 explores the relationships between culture and civil security and the process of geographically analyzing social, political, economic, and demographic information to understand human history, institutions, and behaviors. It is an elective course in the Geospatial Intelligence Certificate, the Intercollege Master of Professional Studies (iMPS-HLS), and the Master of Geographic Information Systems degree program that is offered exclusively through Penn State's World Campus. It is also one of the optional capstone courses that leads to Penn State's Postbaccalaureate Certificate in GIS. The course consists of projects, associated readings, and exams.

Subject:
Cultural Geography
Social Science
Material Type:
Full Course
Provider:
Penn State University
Provider Set:
Penn State's College of Earth and Mineral Sciences (http:// e-education.psu.edu/oer/)
Author:
George Van Otten
Date Added:
09/18/2018
Design a Hiking Trail
Read the Fine Print
Rating
0.0 stars

This lesson provides experience working on a real-life scenario by allowing students the opportunity to use topographic maps to design a hiking trail system based on access from road, range of habitats, and other specified criteria. They will also complete a data sheet and produce an informational brochure.

Subject:
Astronomy
Chemistry
Geoscience
Physical Geography
Physical Science
Physics
Space Science
Material Type:
Activity/Lab
Interactive
Lesson Plan
Provider:
UCAR Staff
Provider Set:
New York State Earth Science Instructional Collection
Author:
Becky Remis
Rose Hochmuth
Date Added:
11/06/2014
Elementary GLOBE: Cloudscape
Read the Fine Print
Rating
0.0 stars

A learning activity for the "Do You Know That Clouds Have Names?" book in the Elementary GLOBE series. Using information from the book and their observations, students construct a sky scene with trees and buildings as reference points on the ground and cloud types ordered by altitude in the sky. Students will describe clouds using their own vocabulary and will then correlate their descriptions with the standard classifications of cloud types used by the GLOBE Program. The purpose of the activity is to help students identify some of the characteristics of clouds and to enable students to observe clouds, describe them in a common vocabulary, and compare their descriptions with the official cloud names. Students will be able to identify cloud types using standard cloud classification names. They will know that the names used for the clouds are based on three factors: their shapes, the altitude at which they occur, and whether they are producing precipitation.

Subject:
Atmospheric Science
Physical Science
Material Type:
Activity/Lab
Diagram/Illustration
Interactive
Lesson Plan
Textbook
Provider:
NASA
Provider Set:
NASA Wavelength
Date Added:
02/16/2011
Elementary GLOBE: To Spread or Not To Spread
Read the Fine Print
Rating
0.0 stars

A learning activity for the "Do You Know That Clouds Have Names?" book in the Elementary GLOBE series. Students will explore the difference between the three types of contrails, make observations of contrails outside, and record their observations. Fifteen minutes later they will make follow-up observations to see how the contrails they observed have changed. The purpose of the activity is to help students identify contrails and learn to distinguish between the three types of contrails and to understand that contrails are human-made and some contrails become clouds in the sky. Students will be able to (1) identify the three types of contrails; (2) understand that contrails are created by jet airplanes; and (3) understand that some contrails become clouds.

Subject:
Atmospheric Science
Physical Science
Material Type:
Activity/Lab
Diagram/Illustration
Interactive
Lesson Plan
Textbook
Provider:
NASA
Provider Set:
NASA Wavelength
Date Added:
02/16/2011
Geographic Foundations of Geospatial Intelligence
Conditional Remix & Share Permitted
CC BY-NC-SA
Rating
0.0 stars

A good detective or researcher like Sherlock Holmes knows the fundamental questions that need to be answered to gather facts to solve a problem. So how does geospatial intelligence contribute to answering these questions? While geospatial technology is useful in revealing who, what, when, and where events take place, it is less useful in explaining why events occur. However, geospatial intelligence analysis leverages geographic information science and technology with the intelligence tradecraft to develop products that support decision-making in national and homeland security, law enforcement, emergency management, and international relief efforts. GEOG 882 will challenge you to think critically, consider alternative viewpoints, and question your own assumptions when analyzing why human events occur over place and time.

Subject:
Applied Science
Business and Communication
Communication
Cultural Geography
Information Science
Physical Geography
Physical Science
Social Science
Material Type:
Full Course
Provider:
Penn State College of Earth and Mineral Sciences
Author:
Mark Corson
Date Added:
10/07/2019
Human Geography
Conditional Remix & Share Permitted
CC BY-NC-SA
Rating
0.0 stars

Word Count: 21682

(Note: This resource's metadata has been created automatically by reformatting and/or combining the information that the author initially provided as part of a bulk import process.)

Subject:
Cultural Geography
Social Science
Material Type:
Textbook
Author:
Christine Rosenfeld
Nathan Burtch
Date Added:
02/10/2022
Human Geography
Conditional Remix & Share Permitted
CC BY-NC-SA
Rating
0.0 stars

Word Count: 22393

(Note: This resource's metadata has been created automatically by reformatting and/or combining the information that the author initially provided as part of a bulk import process.)

Subject:
Cultural Geography
Social Science
Material Type:
Textbook
Date Added:
01/26/2024
Instrument Construction, Site Selection and Set-Up
Read the Fine Print
Rating
0.0 stars

This resource provides guidance on site selection for the GLOBE Atmosphere data collection protocols. Instructions for building an instrument shelter, a snowboard, an ozone measurement station, and a wind direction instrument are included.

Subject:
Applied Science
Ecology
Environmental Science
Life Science
Material Type:
Activity/Lab
Homework/Assignment
Interactive
Lesson Plan
Teaching/Learning Strategy
Provider:
UCAR Staff
Provider Set:
GLOBE Teacher's Guide NGSS Aligned Records
Author:
The GLOBE Program, UCAR (University Corporation for Atmospheric Research)
Date Added:
01/09/2007
Into the Mind of a Transportation Planner (Green Transportation #3)
Conditional Remix & Share Permitted
CC BY-NC
Rating
0.0 stars

SYNOPSIS: This lesson explores different transit systems around the world and unpacks the decision-making process behind transportation planning.

SCIENTIST NOTES: This lesson has students investigate what transportation planners do and the transportation systems of different countries. All external links are valid, and this lesson has passed our scientific review process.

POSITIVES:
-Students have the opportunity to collaborate and reason with each other.
-Students conduct research and present their findings orally.
-Students are exposed to global connections.
-Students activate creativity and imagination.

ADDITIONAL PREREQUISITES:
-This is lesson 3 of 6 in our 3rd-5th grade Green Transportation unit.
-Students should have prior knowledge of accessing information using the Internet.

DIFFERENTIATION:
-Teacher can modify the Investigate section through the following ways based on students' needs:
-Low Level: Teacher provides students with mostly visuals and/or audio recordings describing the different transportation systems and allows students to write keywords and share.
-On Level: Teacher provides students with a mix of visuals and brief sentences from articles describing the different transportation systems. Students can write 1-4 sentences to share.
-High Level: Teacher provides students with complete articles describing the different transit systems and allows students to highlight in the text. Students then write 5+ complete sentences prior to their sharing with the whole class.
-In the Inspire section, students have the option to work independently or in groups.
-If working in groups, students can choose the specific role that fits their personality the best.

Subject:
Physical Geography
Physical Science
Social Science
Material Type:
Lesson Plan
Provider:
SubjectToClimate
Author:
Amber Medina
Lindsey Pockl
Date Added:
06/29/2023
Introduction to Geography
Conditional Remix & Share Permitted
CC BY-NC
Rating
0.0 stars

Short Description:
A text for a one-quarter course on the introduction to both physical and human geography.

Word Count: 96050

(Note: This resource's metadata has been created automatically by reformatting and/or combining the information that the author initially provided as part of a bulk import process.)

Subject:
Cultural Geography
Physical Geography
Physical Science
Social Science
Material Type:
Textbook
Date Added:
01/26/2024
Introduction to Human Geography
Unrestricted Use
CC BY
Rating
0.0 stars

Human geography emphasizes the importance of geography as a field of inquiry and introduces students to the concept of spatial organization. Knowing the location of places, people, and events is a gateway to understanding complex environmental relationships and interconnections among places and across landscapes.

Geographic concepts emphasize location, space, place, scale of analysis, pattern, regionalization, and globalization. These concepts are essential to understanding spatial interaction and spatial behavior, the dynamics of human population growth and migration, patterns of culture, political control of territory, areas of agricultural production, the changing location of industry and economic development strategies, and evolving human settlement patterns, particularly urbanization. Geographers use geospatial technology (e.g., satellite imagery, aerial photography, geographic information systems (GIS), global positioning systems (GPS), and drone technology), spatial data, mathematical formulas, and design models to understand the world from a spatial perspective better.

Human geography enables us to consider the regional organization of various phenomena and encourages geographic analysis to understand processes in a changing world. For example, geographic perspectives on the impact of human activities on the environment, from local to global scales, include effects on land, water, atmosphere, population, biodiversity, and climate. These human ecological examples are inherent throughout the discipline, especially in topics dealing with population growth, agricultural and industrial practices, and rapid urbanization. Geographers apply geographic methods and geospatial technologies to a variety of situations.

Subject:
Cultural Geography
Social Science
Material Type:
Full Course
Author:
R. Adam Dastrup
Date Added:
12/11/2019
Introduction to Human Geography
Conditional Remix & Share Permitted
CC BY-NC-SA
Rating
0.0 stars

A Sustainable Development Perspective

Word Count: 17489

(Note: This resource's metadata has been created automatically by reformatting and/or combining the information that the author initially provided as part of a bulk import process.)

Subject:
Applied Science
Cultural Geography
Environmental Science
Social Science
Material Type:
Textbook
Date Added:
09/01/2020
Introduction to World Regional Geography
Conditional Remix & Share Permitted
CC BY-NC-SA
Rating
0.0 stars

Word Count: 197795

(Note: This resource's metadata has been created automatically by reformatting and/or combining the information that the author initially provided as part of a bulk import process.)

Subject:
Cultural Geography
Physical Geography
Physical Science
Social Science
Material Type:
Textbook
Author:
R. Adam Dastrup
Date Added:
06/01/2020
Introduction to World Regional Geography
Conditional Remix & Share Permitted
CC BY-NC-SA
Rating
0.0 stars

Word Count: 204289

(Note: This resource's metadata has been created automatically by reformatting and/or combining the information that the author initially provided as part of a bulk import process.)

Subject:
Cultural Geography
Physical Geography
Physical Science
Social Science
Material Type:
Textbook
Date Added:
08/20/2019
A Look at Cancer Alley, Louisiana
Conditional Remix & Share Permitted
CC BY-NC
Rating
0.0 stars

SYNOPSIS: In this lesson, students explore an interactive map, learn about Cancer Alley, and take concrete action to address environmental injustice.

SCIENTIST NOTES: This lesson introduces students to environmental justice and asks them to use an EPA mapping tool that shows how polluted an area is. The lesson also includes a video resource from Vox that highlights the area of Louisiana known as “Cancer Alley." To be as perfectly clear as possible, vast amounts of data and evidence show that people of color are disproportionately affected by pollution in the United States, and that higher exposure to pollutants directly correlates to higher incidence of disease. This video was produced in May of 2020, which is quite early on in the pandemic, and as such, some of the numbers presented in it are outdated. This outdated data is only for the numbers given when speaking on COVID-19 mortality rates. For example, the video says that Louisiana’s population is 32% Black (still correct) but Black people account for 56% of COVID-19 deaths. This is no longer the case as of July 2022, and according to data obtained from Louisiana’s government website, Black citizens account for 34% of deaths. While this is still disproportional, it is not as large of a disparity as when the video was produced. The same is true for Michigan, where Black residents now account for 17.5% of deaths but make up 14% of the population (data from michigan.gov). So, while this lesson highlights the importance of environmental justice and is overall scientifically sound, please just take note of the changes in the COVID-19 data.

POSITIVES:
-This lesson clearly connects redlining and environmental racism.
-This lesson shows a concrete example of the effects of systemic racism in the United States.
ADDITIONAL PREREQUISITES:Some students may never have discussed racism and climate change before. Meet your students where they are and encourage them to ask good questions.
-When teaching this sequence, it’s important to acknowledge the historical facts that have led to this injustice. Here are some resources to help you:
-Dr. Ibram X. Kendi defines racist policy as “any measure that produces or sustains racial inequity between racial groups.” (Source: Article from Penguin Publishing Company)
-Government entities suppressed the Black vote through different means until the Voting Rights Act in 1965. (Source: history.com)
-Redlining was outlawed by the Fair Housing Act in 1968. (Source: ThoughtCo)

DIFFERENTIATION:
-It may be necessary to offer the letter-writing as an extension or an extra credit opportunity.
-Be sensitive to the needs of your students, as systemic racism affects them in different ways.

Subject:
Physical Geography
Physical Science
Social Science
Material Type:
Lesson Plan
Provider:
SubjectToClimate
Author:
Dan Castrigano
Lindsey Pockl
Date Added:
06/29/2023
Redlining & Environmental Racism
Conditional Remix & Share Permitted
CC BY-NC
Rating
0.0 stars

SYNOPSIS: This lesson plan connects redlining with current issues of environmental and racial justice.

SCIENTIST NOTES: This is a thoroughly sourced and cited lesson plan. All of the external links meet our quality standards for accuracy and current information. Additionally, the external links are well-sourced, and the data is provided for tools like the Tree Cover Equity map. This lesson has passed our scientific quality assessment.

Positives
-This environmental racism lesson plan clearly connects redlining in the 1930s and environmental injustice today.
-This lesson is extremely powerful because students make the connection between redlined areas and their case studies. It is nuanced and will not always line up perfectly. Overwhelmingly, however, neighborhoods that were redlined are experiencing environmental injustice - higher rates of asthma, unbearable heat, air pollution, and less tree cover. It is an incredibly meaningful "aha moment" for the students.

ADDITIONAL PREREQUISITES:
-There might be some pushback with those who do not understand racism.
-Students might think “I’m not racist.” But it’s important to know that racism exists whether one perpetrates individual racist acts or not.
-For some background information and definitions, use this resource from Dr. Ibram X. Kendi’s book, How to Be an Antiracist.
-It may be useful to discuss how climate change is a “threat multiplier.” For things like urban heat islands and urban tree cover, climate change makes inequities even worse.

DIFFERENTIATION:
-It may be best to group students of different abilities when they are exploring their case studies.
-If you live in the United States you can adapt case study #4 - the American Forests Tree Equity Score Map - to whichever major city is closest to your school. The lesson is designed for students to explore Philadelphia, but students can simply look at any other city to make the connection between redlining and urban tree cover.

Subject:
History
Physical Geography
Physical Science
Political Science
Social Science
Material Type:
Lesson Plan
Provider:
SubjectToClimate
Author:
Dan Castrigano
Date Added:
06/30/2023