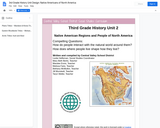
This unit on American Indians: By studying the regions of the United …
This unit on American Indians: By studying the regions of the United States and the cultures that live in each region, students are able to compare/contrast within regions and across regions how tribes used their environments, and their cultural and other contributions to American life.
Note that the emphasis here is on broader groups of tribes for each region with some instruction on specific tribes representing each region. In no way is this case study approach to learning about one tribe meant to be generalized to all tribes of that region. We understand that each tribe was and continues to be unique in its culture, practices, lifeways, and traditions.
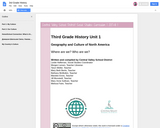
The unit is focused on the examination of geography in terms of …
The unit is focused on the examination of geography in terms of “place.” Students dive into inquiry to answer the compelling questions, “Where are we?” and “Who are we?” Through these two questions students will understand where they live and where people around the world live. Students will also dive into the term “culture” and define it through many characteristics. Students will examine and reflect upon their own culture and research different cultures of North America.
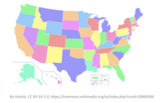
We live on the continent of North America in the country of …
We live on the continent of North America in the country of the United States. There are 50 states in this great country and as citizens of the United States we should know what those states are. In this seminar you will learn the names and locations of all 50 states. Wow your friends and family with your geographical knowledge! Standards7.1.4.B Describe and locate places and regions as defined by physical and human features.
This contemplative practice inquires into the complex web of interdependencies linking global …
This contemplative practice inquires into the complex web of interdependencies linking global climate change, the War on Terror, Afghan poppy production, opiate addiction, and food security through the lens of systems theory. The exercise challenges students to consider these linkages not only conceptually but also somatically and emotionally.
(Note: this resource was added to OER Commons as part of a batch upload of over 2,200 records. If you notice an issue with the quality of the metadata, please let us know by using the 'report' button and we will flag it for consideration.)
This course considers how, despite its immense diversity, Africa continues to hold …
This course considers how, despite its immense diversity, Africa continues to hold purchase as both a geographical entity and meaningful knowledge category. It examines the relationship between articulations of "Africa" and projects like European imperialism, developments in the biological sciences, African de-colonization and state-building, and the imagining of the planet's future. Readings in anthropology and history are organized around five themes: space and place, race, representation, self-determination, and time.
Al-Bab is a portal website designed to introduce non-Arabs to Arab culture …
Al-Bab is a portal website designed to introduce non-Arabs to Arab culture by providing links to news sources, country profiles, articles, and a blog on Middle East current events. There are also specific links related to learning Arabic: dictionaries, language classes, textbooks, and other information pertaining to the study of Arabic. A free e-book, The Birth of Modern Yemen, is available for download.
presents a travel itinerary of 58 historic places across Arizona, Colorado, and …
presents a travel itinerary of 58 historic places across Arizona, Colorado, and New Mexico. It includes forts built to protect mail routes and settlers, missions and churches, prehistoric cliff dwellings, trading posts, petroglyphs (from the petrified forest), pit house villages, and Indian villages home to the Anasazi, Sinagua, Zuni, and other Native American tribes.
This inquiry leads students through an investigation of Americans moving west. Students …
This inquiry leads students through an investigation of Americans moving west. Students will learn about land use in America, the population change in America, and the Indian Removal Act of 1830. Resource created by Justin Bray, Fremont Public Schools, as part of the Nebraska ESUCC Social Studies Special Projects 2023 Inquiry Design Model (IDM).
his lesson uses music and art in a vocabulary study of unfamiliar …
his lesson uses music and art in a vocabulary study of unfamiliar words from the song "America the Beautiful," increasing students' vocabulary while also increasing their knowledge of U.S. geography. A discussion to activate students' prior knowledge about sights and scenery throughout the United States is followed by a read-aloud and introduction to the song "America the Beautiful," which is then sung in each session of the lesson. Students learn the meanings of the song's words through shared reading and the use of context clues and images. Students then use photographs, illustrations, and descriptive language to create a mural shaped like the United States. Finally, through pictures and words, students reflect on what they have learned. This lesson is appropriate and adaptable for any patriotic event or holiday, and many of the vocabulary strategies are adaptable for other texts or word lists, as well.
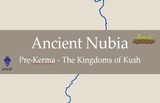
These educational videos provide an invaluable resource on Ancient Nubia for Middle …
These educational videos provide an invaluable resource on Ancient Nubia for Middle and High School Ancient World History and Geography teachers and students. The video content aligns with Geography, Economics, Civics, and Historical Thinking Social Studies standards across the nation. Key concepts and inquiry skills from each content area weave seamlessly throughout the videos and associated lesson plans. This unit overview document links to developed resources on the Archeology in the Community site.
Word Count: 7198 (Note: This resource's metadata has been created automatically by …
Word Count: 7198
(Note: This resource's metadata has been created automatically by reformatting and/or combining the information that the author initially provided as part of a bulk import process.)
Word Count: 9323 (Note: This resource's metadata has been created automatically by …
Word Count: 9323
(Note: This resource's metadata has been created automatically by reformatting and/or combining the information that the author initially provided as part of a bulk import process.)
This kit is aimed at teachers and their pupils at the end …
This kit is aimed at teachers and their pupils at the end of primary school education living in areas affected by or under threat from desertification.
This site makes available for viewing the nearly nine hundred images of …
This site makes available for viewing the nearly nine hundred images of modes of transportation taken by American photographer William Henry Jackson in North Africa, Asia, Australia, and Oceania. The site allows searches by subject and Keyword, and gives archival information about it.
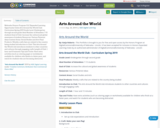
Nebraska Honors Program CLC Expanded Learning Opportunity Clubs Arts Around the World …
Nebraska Honors Program CLC Expanded Learning Opportunity Clubs Arts Around the World Club Curriculum Spring 2019 Grade Level: Kindergarten through second grade Ideal Number of Attendees: 7-15 students Goal of Club: Increase the cultural and global awareness of students Resources: Various Pinterest ideas Content Areas: Social Studies and Arts Final Products: Weekly crafts that are related to the country being studied Introduction to Club: This Arts Around the World club introduces students to other countries and cultures through engaging crafts Length of Club: 1 hour and 15 minutes Tips and Tricks: Have extra activities (such as coloring pages or worksheets) available for children who finish at a faster pace, and watch for students who are becoming distracted.
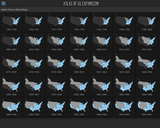
Blue Coral Atlas of US Expansion tells the geographic story of the …
Blue Coral Atlas of US Expansion tells the geographic story of the United States from the original thirteen colonies to today. View all the maps together in a single scroll or choose maps either individually or in series together for a closer look.
Blue Coral Atlas of US Expansion is fully responsive in the web browser for large and small devices in both horizontal and vertical orientations.
No restrictions on your remixing, redistributing, or making derivative works. Give credit to the author, as required.
Your remixing, redistributing, or making derivatives works comes with some restrictions, including how it is shared.
Your redistributing comes with some restrictions. Do not remix or make derivative works.
Most restrictive license type. Prohibits most uses, sharing, and any changes.
Copyrighted materials, available under Fair Use and the TEACH Act for US-based educators, or other custom arrangements. Go to the resource provider to see their individual restrictions.