This course contains five projects, plus a course introduction and course closure, …
This course contains five projects, plus a course introduction and course closure, that are organized around the following question: “How can we rethink our use of the world’s resources?” Each project involves investigations of sustainability that help contextualize the content required by the new College Board course framework.
This AP Environmental Science class is intended to meet the same objectives …
This AP Environmental Science class is intended to meet the same objectives as a first-year college-based course. However, the method of instruction for this course is unique compared to similar courses because we have adopted a project-based learning (PBL) approach. Although PBL may take many forms, our approach involves student investigations and simulations that require students to think like scientists, policymakers, farmers, and other adults in real-world settings. Teachers engage students in collaborative problem solving, argumentation, and deep exploration of the concepts and principles of the discipline. The goal for student learning is understanding rather than relying on rote memory to create meaningful learning and knowledge that is actionable, adaptive, and transferable.
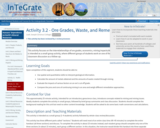
This activity focuses on the interrelationships of ore grades, economics, mining impacts/decisions, …
This activity focuses on the interrelationships of ore grades, economics, mining impacts/decisions, and other factors. It is intended as a small-group activity, where different groups of students work on one of three different parts, with classroom discussion as a follow-up.
(Note: this resource was added to OER Commons as part of a batch upload of over 2,200 records. If you notice an issue with the quality of the metadata, please let us know by using the 'report' button and we will flag it for consideration.)
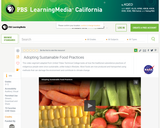
Hear about how respect for Earth can help us attain a more …
Hear about how respect for Earth can help us attain a more sustainable lifestyle in the face of climate change in this video segment adapted from United Tribes Technical College.
This activity is an indoor/outdoor activity that incorporates both literacy and scientific …
This activity is an indoor/outdoor activity that incorporates both literacy and scientific observation to make an ABC book based on Antler, Bear, Canoe by Betsy Bowen. Family participation is encouraged.
This activity is an indoor/outdoor activity that incorporates both literacy and scientific …
This activity is an indoor/outdoor activity that incorporates both literacy and scientific observation to make an ABC book based on Antler, Bear, Canoe by Betsy Bowen.
This contemplative practice inquires into the complex web of interdependencies linking global …
This contemplative practice inquires into the complex web of interdependencies linking global climate change, the War on Terror, Afghan poppy production, opiate addiction, and food security through the lens of systems theory. The exercise challenges students to consider these linkages not only conceptually but also somatically and emotionally.
(Note: this resource was added to OER Commons as part of a batch upload of over 2,200 records. If you notice an issue with the quality of the metadata, please let us know by using the 'report' button and we will flag it for consideration.)
In this video adapted from Storyknife Productions, Alaska Native pilots share how …
In this video adapted from Storyknife Productions, Alaska Native pilots share how they use traditional knowledge to read the landscape and predict the weather.
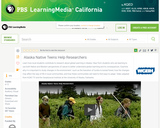
In this video adapted from KUAC-TV and the Geophysical Institute at the …
In this video adapted from KUAC-TV and the Geophysical Institute at the University of Alaska, Fairbanks, Alaska Native students contribute to research on how their environment is changing as a result of global warming.
In this Interactive Lecture Demonstration, students will predict the main issues that …
In this Interactive Lecture Demonstration, students will predict the main issues that might be included in short French language videos treating topics such as endangered species, organic farming, the effect of aerosols on the environment, pollution and sustainable development. They will then view short videos on the topics and reflect on how their prior assumptions meshed with reality.
Road deicers raise several environmental and cost concerns. In this activity students …
Road deicers raise several environmental and cost concerns. In this activity students consider alternatives while investigating colligative properties.
(Note: this resource was added to OER Commons as part of a batch upload of over 2,200 records. If you notice an issue with the quality of the metadata, please let us know by using the 'report' button and we will flag it for consideration.)
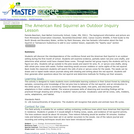
This is outdoor activity involving students in gathering information on what an …
This is outdoor activity involving students in gathering information on what an American Red Squirrel Eats and its interdependence with the coniferous forest.
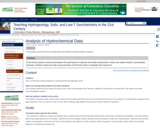
In this activity students examine groundwater flow path based on hydraulic head …
In this activity students examine groundwater flow path based on hydraulic head data/ potentiometric surface and spatial variation of groundwater chemistry. Students analyze the data using AquaChem and Phreeqc which is integrated with AquaChem
(Note: this resource was added to OER Commons as part of a batch upload of over 2,200 records. If you notice an issue with the quality of the metadata, please let us know by using the 'report' button and we will flag it for consideration.)
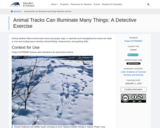
Having students follow animal tracks (even just people, dogs, or squirrels) and …
Having students follow animal tracks (even just people, dogs, or squirrels) and investigating how tracks are made is a fun and exciting way to develop critical thinking, measurement, and graphing skills.
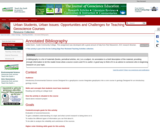
Annotations are short and cannot give detailed information, but they should cover …
Annotations are short and cannot give detailed information, but they should cover these points: 1. The general contents of the work. What does it discuss and how detailed is it? This is the main portion of the annotation. 2. The author's qualifications. Is the writer a trained scholar? A journalist? Someone relating a personal experience? 3. An evaluation of the reliability. Is the information given reliable? Are facts or opinions stressed? 4. The intended audience. Is it for a general reader or a specialist? How much, if any, background knowledge is needed to understand it? Was is easy or difficult to read?
(Note: this resource was added to OER Commons as part of a batch upload of over 2,200 records. If you notice an issue with the quality of the metadata, please let us know by using the 'report' button and we will flag it for consideration.)
What would happen if a portion of the Antarctic Ice Sheet were …
What would happen if a portion of the Antarctic Ice Sheet were to melt? This video segment adapted from NOVA uses animations to show the effect of a 6-meter sea-level rise on coastal cities across the world.
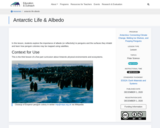
In this lesson, students explore the importance of albedo (or reflectivity) to …
In this lesson, students explore the importance of albedo (or reflectivity) to penguins and the surfaces they inhabit and learn how penguin colonies may be mapped using satellites.
No restrictions on your remixing, redistributing, or making derivative works. Give credit to the author, as required.
Your remixing, redistributing, or making derivatives works comes with some restrictions, including how it is shared.
Your redistributing comes with some restrictions. Do not remix or make derivative works.
Most restrictive license type. Prohibits most uses, sharing, and any changes.
Copyrighted materials, available under Fair Use and the TEACH Act for US-based educators, or other custom arrangements. Go to the resource provider to see their individual restrictions.