By the end of this section, you will be able to:Explain what …
By the end of this section, you will be able to:Explain what a correlation coefficient tells us about the relationship between variablesRecognize that correlation does not indicate a cause-and-effect relationship between variablesDiscuss our tendency to look for relationships between variables that do not really existExplain random sampling and assignment of participants into experimental and control groupsDiscuss how experimenter or participant bias could affect the results of an experimentIdentify independent and dependent variables
Students will use state and regional unemployment data for various education levels …
Students will use state and regional unemployment data for various education levels to create scatter plots and calculate correlation coefficients. Students will then compare scatter plots with different strengths of linear relationships and will determine the impact of any influential points on the correlation coefficient.
Students act as R&D entrepreneurs, learning ways to research variables affecting the …
Students act as R&D entrepreneurs, learning ways to research variables affecting the market of their proposed (hypothetical) products. They learn how to obtain numeric data using a variety of Internet tools and resources, sort and analyze the data using Excel and other software, and discover patterns and relationships that influence and guide decisions related to launching their products. First, student pairs research and collect pertinent consumer data, importing the data into spreadsheets. Then they clean, organize, chart and analyze the data to inform their product production and marketing plans. They calculate related statistics and gain proficiency in obtaining and finding relationships between variables, which is important in the work of engineers as well as for general technical literacy and decision-making. They summarize their work by suggesting product launch strategies and reporting their findings and conclusions in class presentations. A finding data tips handout, project/presentation grading rubric and alternative self-guided activity worksheet are provided. This activity is ideal for a high school statistics class.
The applets in this section allow you to see how different bivariate …
The applets in this section allow you to see how different bivariate data look under different correlation structures. The Movie applet either creates data for a particular correlation or animates a multitude data sets ranging correlations from -1 to 1.
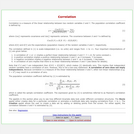
An introduction and examples of how to use Correlation and Simple Linear …
An introduction and examples of how to use Correlation and Simple Linear Regression. Explaining concepts as coefficient of correlation, dependent variables, independent variables and the straight line equation and residuals.
With your mouse, drag data points and their error bars, and watch …
With your mouse, drag data points and their error bars, and watch the best-fit polynomial curve update instantly. You choose the type of fit: linear, quadratic, cubic, or quartic. The reduced chi-square statistic shows you when the fit is good. Or you can try to find the best fit by manually adjusting fit parameters.
This lesson unit is intended to help teachers assess how well students …
This lesson unit is intended to help teachers assess how well students understand the notion of correlation. In particular this unit aims to identify and help students who have difficulty in: understanding correlation as the degree of fit between two variables; making a mathematical model of a situation; testing and improving the model; communicating their reasoning clearly; and evaluating alternative models of the situation.
Students will develop, justify, and evaluate conjectures about the relationship between two …
Students will develop, justify, and evaluate conjectures about the relationship between two quantitative variables over time in the United States: the median age (in years) when women first marry and the percentage of women aged 25–34 with a bachelor’s degree or higher. Students will write a regression equation for the data, interpret in context the linear model’s slope and y-intercept, and find the correlation coefficient (r), assessing the strength of the linear relationship and whether a significant relationship exists between the variables. Students will then summarize their conclusions and consider whether correlation implies causation.
These resources were created to compliment our undergraduate statistics lab manual, Applied …
These resources were created to compliment our undergraduate statistics lab manual, Applied Data Analysis in Psychology: Exploring Diversity with Statistics, published by Kendall Hunt publishing company. Like our lab manual, these JASP walk-through guides meaningfully and purposefully integrate and highlight diversity research to teach students how to analyze data in an open-source statistical program. The data sets utilized in these guides are from open-access databases (e.g., Pew Research Center, PLoS One, ICPSR, and more). Guides with step-by-step instructions, including annotated images and examples of how to report findings in APA format, are included for the following statistical tests: independent samples t test, paired samples t test, one-way ANOVA, two factor ANOVA, chi-square test, Pearson correlation, simple regression, and multiple regression.
This paper serves as an exploration into some of the ways in …
This paper serves as an exploration into some of the ways in which organizations can promote, capture, share, and manage the valuable knowledge of their employees. The problem is that employees typically do not share valuable information, skills, or expertise with other employees or with the entire organization. The author uses research as well as her graduate studies in the field of Human Resource Development (HRD) and professional career experiences as an instructor and training and development consultant to make a correlation between the informal workplace learning experiences that exist in the workplace and the need to promote, capture, and support them so they can be shared throughout the organization. This process, referred to as knowledge sharing, is the exchange of information, skills, or expertise among employees of an organization that forms a valuable intangible asset and is dependent upon an organization culture that includes knowledge sharing, especially the sharing of the knowledge and skills that are acquired through informal workplace learning; performance support to promote informal workplace learning; and knowledge management to transform valuable informal workplace learning into knowledge that is promoted, captured, and shared throughout the organization.
This resource is a video abstract of a research paper created by …
This resource is a video abstract of a research paper created by Research Square on behalf of its authors. It provides a synopsis that's easy to understand, and can be used to introduce the topics it covers to students, researchers, and the general public. The video's transcript is also provided in full, with a portion provided below for preview:
"Critically ill COVID-19 patients under invasive mechanical ventilation (IMV) are at greatly increased risk of death compared to the general population. While some drivers of COVID-19 disease progression, such as inflammation and hypercoagulability, have been identified, they do not completely explain the mortality of critically ill COVID-19 patients, making a search for overlooked factors necessary. A recent study examined the virome of tracheal aspirates from 25 COVID-19 patients under IMV. These samples were compared to tracheal aspirates from non-COVID patients and nasopharyngeal swabs from individuals with mild COVID-19. Critically ill COVID-19 patients had elevated expression of human endogenous retrovirus K (HERV-K), and elevated HERV-K expression in tracheal aspirate and plasma was associated with early mortality in those same patients. Among deceased patients, HERV-K expression was associated with IL-17-related inflammation, monocyte activation, and increased consumption of clotting factors..."
The rest of the transcript, along with a link to the research itself, is available on the resource itself.
This course gives a mathematical introduction to neural coding and dynamics. Topics …
This course gives a mathematical introduction to neural coding and dynamics. Topics include convolution, correlation, linear systems, game theory, signal detection theory, probability theory, information theory, and reinforcement learning. Applications to neural coding, focusing on the visual system are covered, as well as Hodgkin-Huxley and other related models of neural excitability, stochastic models of ion channels, cable theory, and models of synaptic transmission. Visit the Seung Lab Web site.
Introduction to Sociology 2e adheres to the scope and sequence of a …
Introduction to Sociology 2e adheres to the scope and sequence of a typical, one-semester introductory sociology course. It offers comprehensive coverage of core concepts, foundational scholars, and emerging theories, which are supported by a wealth of engaging learning materials. The textbook presents detailed section reviews with rich questions, discussions that help students apply their knowledge, and features that draw learners into the discipline in meaningful ways. The second edition retains the book’s conceptual organization, aligning to most courses, and has been significantly updated to reflect the latest research and provide examples most relevant to today’s students. In order to help instructors transition to the revised version, the 2e changes are described within the preface.
Differentiate between four kinds of research methods: surveys, field research, experiments, and …
Differentiate between four kinds of research methods: surveys, field research, experiments, and secondary data analysisUnderstand why different topics are better suited to different research approaches
This is a three-credit course which covers topics that enhance the students’ …
This is a three-credit course which covers topics that enhance the students’ problem solving abilities, knowledge of the basic principles of probability/statistics, and guides students to master critical thinking/logic skills, geometric principles, personal finance skills. This course requires that students apply their knowledge to real-world problems. A TI-84 or comparable calculator is required. The course has four main units: Thinking Algebraically, Thinking Logically and Geometrically, Thinking Statistically, and Making Connections. This course is paired with a course in MyOpenMath which contains the instructor materials (including answer keys) and online homework system with immediate feedback. All course materials are licensed by CC-BY-SA unless otherwise noted.
Topics List for this Lesson: Sampling, Frequency Distributions, and GraphsMeasures of CenterMeasures of …
Topics List for this Lesson: Sampling, Frequency Distributions, and GraphsMeasures of CenterMeasures of VarianceNormal Distributions and Problem SolvingZ-Scores and Unusual ValuesEmpirical Rule and Central Limit TheoremScatterplots, Correlation, and Regression
No restrictions on your remixing, redistributing, or making derivative works. Give credit to the author, as required.
Your remixing, redistributing, or making derivatives works comes with some restrictions, including how it is shared.
Your redistributing comes with some restrictions. Do not remix or make derivative works.
Most restrictive license type. Prohibits most uses, sharing, and any changes.
Copyrighted materials, available under Fair Use and the TEACH Act for US-based educators, or other custom arrangements. Go to the resource provider to see their individual restrictions.