In this scenario-based, problem-based learning (PBL) activity, students investigate cloud formation, cloud …
In this scenario-based, problem-based learning (PBL) activity, students investigate cloud formation, cloud classification, and the role of clouds in heating and cooling the Earth; how to interpret TRMM (Tropical Rainfall Measuring Mission) images and data; and the role clouds play in the Earth’s radiant budget and climate. Students assume the role of weather interns in a state climatology office and assist a frustrated student in a homework assignment. Learning is supported by a cloud in a bottle and an ice-albedo demonstration, a three-day cloud monitoring outdoor activity, and student journal assignments. The hands-on activities require two 2-liter soda bottles, an infrared heat lamp, and two thermometers. The resource includes a teacher's guide, questions and answer key, assessment rubric, glossary, and an appendix with information supporting PBL in the classroom.
Climographs, graphic plots of monthly temperature and precipitation, allow students to see …
Climographs, graphic plots of monthly temperature and precipitation, allow students to see how differences in insolation at various locations affect rates of heating and cooling. In this activity, students use climographs to plot locations using latitude and longitude, calculate annual temperature ranges, and relate unequal rates of heating and cooling to climate variations. They will also construct climographs for two locations in New York, analyze them, and answer questions about their observations.
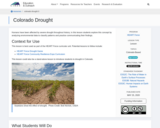
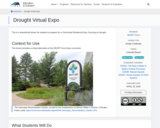
Humans have been affected by severe drought throughout history; in this lesson …
Humans have been affected by severe drought throughout history; in this lesson students explore this concept by analyzing environmental data to classify patterns and practice communicating their findings.
In this activity, students investigate sea level change during glacial maxima during …
In this activity, students investigate sea level change during glacial maxima during the Ice Ages, and learn how lowered sea level presented additional routes for intercontinental human migration. Summary background information, data and images supporting the activity are available on the Earth Update data site. To complete the activity, students will need to access the Space Update multimedia collection, which is available for download and purchase for use in the classroom.
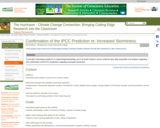
This activity represents a culmination project for this unit by means of …
This activity represents a culmination project for this unit by means of which students can assess whether the IPCC prediction of increased storminess as an outcome of global warming survives testing. For the previous three weeks students will have conducted several inquiry-based group activities designed to introduce and reinforce fundamental meteorology/climatology concepts. In this 2-day project, students access online AVHRR SST imagery, as well as tabulated numeric data regarding historical North American tropical cyclones, import data into Excel for interpretation and analysis, and submit two group reports.
(Note: this resource was added to OER Commons as part of a batch upload of over 2,200 records. If you notice an issue with the quality of the metadata, please let us know by using the 'report' button and we will flag it for consideration.)
This experimental activity is designed to develop a basic understanding of the …
This experimental activity is designed to develop a basic understanding of the relationship between temperature and pressure and that a barometer can be constructed to detect this relationship. Resources needed to build a simple barometer include a canning jar with metal lid ring, large balloon, a block of wood, ruler, a nail, wood glue, hammer and a screwdriver. The resource includes background information, teaching tips and questions to guide student discussion. This is chapter 6 of Meteorology: An Educator's Resource for Inquiry-Based Learning for Grades 5-9. The guide includes a discussion of learning science, the use of inquiry in the classroom, instructions for making simple weather instruments, and more than 20 weather investigations ranging from teacher-centered to guided and open inquiry investigations.
The purpose of this activity is to construct a model that will …
The purpose of this activity is to construct a model that will provide students with a visual representation of parts per billion. Students work in teams to construct cubes of different volumes and to compare them to get a feel for parts per million by volume and parts per billion by volume. The intended outcome is that students gain a feeling for the small quantities of gases, such as ozone, present in the Earth's atmosphere.
This video segment adapted from the Atmospheric Radiation Program explains the differences …
This video segment adapted from the Atmospheric Radiation Program explains the differences in the formation of tropical convective cloud systems over islands and over the ocean.
In this activity, student teams identify the locations of coral reefs around …
In this activity, student teams identify the locations of coral reefs around the world, examine infrared satellite images of the Earth, and research the impacts that are threatening the survival of coral reefs. Each team creates a short oral presentation describing the coral reef they have researched. Students then plot on a composite map the locations where coral bleaching is occurring. Student worksheets, a teacher guide, and assessment rubric are included. This activity is part of Coastal Areas: Coral Reefs in Hot Water, part of the lesson series, The Potential Consequences of Climate Variability and Change.
In this lesson, students create a compass and apply their reasoning about …
In this lesson, students create a compass and apply their reasoning about magnetism to how compasses work to help us navigate around the globe while utilizing the Earth’s magnetic field.
This lesson incorporates sea surface data collected by NASA satellites. Data for …
This lesson incorporates sea surface data collected by NASA satellites. Data for three surface characteristics- height, temperature and speed- are used for several activities. Students examine the differences in speed of currents relative to distance from the Equator. Sea surface data anomalies are charted and further analyzed. In addition, surface current data is presented to examine patterns related to El Niño. Note that this is lesson three of five on the Ocean Motion website. Each lesson investigates ocean surface circulation using satellite and model data and can be done independently. See Related URL's for links to the Ocean Motion Website that provide science background information, data resources, teacher material, student guides and a lesson matrix.
In this problem-based learning (PBL) activity, students take on the role of …
In this problem-based learning (PBL) activity, students take on the role of a student research scientist and explore the role of solar energy in determining climate, focusing on the urban heat island effect. Students conduct research and compare temperatures between two cities, and determine the factors that are responsible for the difference exhibited between them. The lesson is supported by teacher notes, answer key, glossary and an appendix with information about using PBL in the classroom. This is the third of three activities in Investigating the Climate System: Energy, a Balancing Act, and serves as an authentic assessment for all three modules.
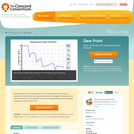
Determine the dew point temperature for your classroom through a hands-on experiment. …
Determine the dew point temperature for your classroom through a hands-on experiment. Use humidity and temperature probes to investigate the temperature at which it would rain in your classroom! Learn about water density and the conditions necessary to produce fog or rain.
In this activity, students monitor the change that takes place when water …
In this activity, students monitor the change that takes place when water vapor condenses from a gas to a liquid and see how a change in temperature affects this transformation. Materials needed to conduct the investigation include two thermometers, a clear glass container, ice cubes and tap water. The resource includes background information, teaching tips and questions to guide student discussion. This is chapter 10 of Meteorology: An Educator's Resource for Inquiry-Based Learning for Grades 5-9. The guide includes a discussion of learning science, the use of inquiry in the classroom, instructions for making simple weather instruments, and more than 20 weather investigations ranging from teacher-centered to guided and open inquiry investigations.
This experimental activity is designed to develop an understanding that air has …
This experimental activity is designed to develop an understanding that air has mass. Students conduct an investigation and observe the change in the position of a bar balancing a balloon inflated with air on one end and a uninflated balloon on the other end. Resources needed include a piece of wood, two rubber balloons, two large paper clips, ruler, nail, hammer and tape. The resource includes background information, teaching tips and questions to guide student discussion. This is chapter 7 of Meteorology: An Educator's Resource for Inquiry-Based Learning for Grades 5-9. The guide includes a discussion of learning science, the use of inquiry in the classroom, instructions for making simple weather instruments, and more than 20 weather investigations ranging from teacher-centered to guided and open inquiry investigations.
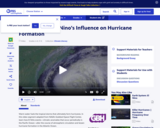
This video segment adapted from NASA's Goddard Space Flight Center explains how …
This video segment adapted from NASA's Goddard Space Flight Center explains how hurricanes develop and why there are fewer hurricanes in the Atlantic Ocean in strong El Niño years.
This module explores the composition of the earth's atmosphere, how temperature and …
This module explores the composition of the earth's atmosphere, how temperature and pressure vary in the atmosphere, and the scientific developments that led to an understanding of these basic concepts.
No restrictions on your remixing, redistributing, or making derivative works. Give credit to the author, as required.
Your remixing, redistributing, or making derivatives works comes with some restrictions, including how it is shared.
Your redistributing comes with some restrictions. Do not remix or make derivative works.
Most restrictive license type. Prohibits most uses, sharing, and any changes.
Copyrighted materials, available under Fair Use and the TEACH Act for US-based educators, or other custom arrangements. Go to the resource provider to see their individual restrictions.