In this demonstration, students explore the concept of greenhouse warming. They determine …
In this demonstration, students explore the concept of greenhouse warming. They determine whether an increase in the amount of heat-trappping gases in the atmosphere can cause the temperature on Earth to rise. Students compare the relative heat retention in two experimental systems that are identical except for one being covered with plastic wrap. Materials required include two small aquarium tanks, plastic wrap, two clamp lamps with 60 watt bulbs, modeling clay, rocks and pebbles, and two thermometers. Teacher background information, student worksheets and a scoring rubric are included. This is Activity 1 of the module Too Many Blankets, part of the lesson series, The Potential Consequences of Climate Variability and Change.
In this activity, students investigate how the atmosphere changes with altitude. They …
In this activity, students investigate how the atmosphere changes with altitude. They will obtain atmospheric data for locations of their choosing using online resources, graph it, and examine it to answer questions about changes in temperature, pressure, humidity, and dewpoint with altitude.
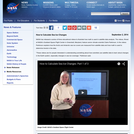
This set of three videos illustrates how math is used in satellite …
This set of three videos illustrates how math is used in satellite data analysis. The videos feature NASA senior climate scientist Claire Parkinson. Parkinson explains how the Arctic and Antarctic sea ice covers are measured from satellite data and how math is used to determine trends in the data. In the first video, she leads viewers from satellite data collection through obtaining a time series of monthly average sea ice extents for November 1978 – December 2012, for the Arctic and Antarctic. In the second video, she begins with the time series from the first video, removes the seasonal cycle by calculating yearly averages, and proceeds to calculate the slopes of the lines to get trends in the data, revealing decreasing sea ice coverage in the Arctic and increasing sea ice coverage in the Antarctic. In the third video, she uses a more advanced technique to remove the seasonal cycle and shows that the trends are close to the same, whichever method is used. She emphasizes the power of math and that the techniques shown for satellite sea ice data can also be applied to a wide range of data sets.
Students will be required to answer a series of simple questions for …
Students will be required to answer a series of simple questions for this assignment based on material covered in lecture. This assignment also allows students the experience of searching a website for more specific information about hurricane statistics that are not covered in lecture. Hurricane Katrina will be discussed in lecture. Students will see where Katrina falls relative to other major hurricanes while answering the questions.
(Note: this resource was added to OER Commons as part of a batch upload of over 2,200 records. If you notice an issue with the quality of the metadata, please let us know by using the 'report' button and we will flag it for consideration.)
In this activity, students investigate data from Hurricane Ivan, the September 2004 …
In this activity, students investigate data from Hurricane Ivan, the September 2004 storm that devastated the Caribbean Islands and the Alabama Gulf Coast before looping across Florida and back into the Gulf of Mexico, where it regenerated into a new storm system. They will analyze data on the storm's location, windspeed, and barometric pressure, develop study questions, and map the hurricane's position at selected intervals.
This homework assignment is given in the first two weeks of class. …
This homework assignment is given in the first two weeks of class. Students receive one or two lectures that cover the topics of atmospheric layers, temperature and pressure profiles, concepts of atmospheric mass and pressure and measuring (i.e. dropsonde) instrumentation. At the beginning of each lecture I briefly show them the tropical update from the NOAA National Hurricane Center web site; if there is an active storm, I show where I go to get more info, such as the projected storm track and storm history (for example, from Intellicast Hurricane Tracking). Then, for this assignment, I reintroduce them to these hurricane information web sites and demonstrate how to find the historical data on tropical storms (such as from the Unisys Hurricane Data Archive), and how to copy and paste text data into word and/or excel, as a tab- or space-delimited file. I point out some problem areas with this data-grabbing method, such as headers that get lost from their associated data column or date information that may not format as dates. I then hand out the assignment, which asks them to:
Find data on a current or recent (this year) tropical system, provide the name and year of the storm and the reference web site, and plot the wind speed and pressure variables against time. Students should label the axes and give a descriptive title to the chart. Describe what they notice in the graphed data and if it seems believable (this allows students to decide if they have done the task correctly by using their understanding of the data). Predict what will happen if the storm a) intensifies or b) weakens. I then provide another data set (of any long-duration tropical storm that formed, weakened and later re-intensified) and ask them to go through the same process of plotting and interpretation. I tell them that some future climate predictions are for more storms with lower central pressures and ask which of the two charts best represents that future scenario, and why.
(Note: this resource was added to OER Commons as part of a batch upload of over 2,200 records. If you notice an issue with the quality of the metadata, please let us know by using the 'report' button and we will flag it for consideration.)
This resource is a 4 x 6" lenticular card on NASA's HS3 …
This resource is a 4 x 6" lenticular card on NASA's HS3 (Hurricane and Severe Storm Sentinel) aircraft mission, which will overfly tropical storms and hurricanes using NASA's Global Hawk Unmanned Aircraft Systems (UAS) in the Northern Atlantic, Caribbean, and Gulf of Mexico. These flights will improve our understanding of the processes that lead to the development of intense hurricanes. The mission will take place for one-month periods during the 2012, 2013, and 2014 Atlantic Basin hurricane seasons.
This lesson has students explore how the gases trapped in ice cores …
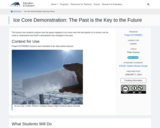
This lesson has students explore how the gases trapped in ice cores over the last quarter of a century can be used to understand how Earth's atmosphere has changed in the past.
This resource provides guidance on site selection for the GLOBE Atmosphere data …
This resource provides guidance on site selection for the GLOBE Atmosphere data collection protocols. Instructions for building an instrument shelter, a snowboard, an ozone measurement station, and a wind direction instrument are included.
This ChemMatters article provides a brief background on smog, then examines the …
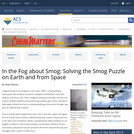
This ChemMatters article provides a brief background on smog, then examines the causes of it, efforts to reduce it, and methods used to measure it. ChemMatters is an educational magazine for high school students.
This activity is a reinforcement lab activity where students experiment with ways …
This activity is a reinforcement lab activity where students experiment with ways to get water to flow out of a cup and up a straw causing an imbalance in the atmospheric pressure surrounding the water.
Students will generate maps of ozone concentrations, graph air quality indices, and …
Students will generate maps of ozone concentrations, graph air quality indices, and propose solutions to problems with the ozone and air quality, specifically smog.
(Note: this resource was added to OER Commons as part of a batch upload of over 2,200 records. If you notice an issue with the quality of the metadata, please let us know by using the 'report' button and we will flag it for consideration.)
This experiment uses the heating of water to explore the concepts of …
This experiment uses the heating of water to explore the concepts of density and volume. Students learn about the transfer of heat energy within the atmosphere, hydrosphere, and Earth's interior, and connect this transfer to differences in density, which in turn result in motion. As part of the investigation, students will also become familiar with the Celsius and Fahrenheit temperature scales.
In essence, this is an opportunity for students to practice calculating trends …
In essence, this is an opportunity for students to practice calculating trends with uncertainties to draw conclusions about whether or not there is a trend in hurricane intensity. It follows closely with the IPCC AR4 findings, and is guided so that students will know exactly what they have to do - step by step. Please see the attached document for the bulk of the activity. There are some additional instructor's notes that give a little more background on the concepts involved with confidence intervals and trends. There is also an excel file with all of the necessary data already tabulated for the exercise - so you don't need to go find it yourself unless you want to.
(Note: this resource was added to OER Commons as part of a batch upload of over 2,200 records. If you notice an issue with the quality of the metadata, please let us know by using the 'report' button and we will flag it for consideration.)
In this video-based activity, students learn that sea level is an average …
In this video-based activity, students learn that sea level is an average measurement of the height of the ocean, and sea level changes with the seasons and over time. El Niño and La Ninña events are compared, demonstrating that sea height is a function of temperature.Summary background information, data and images supporting the activity are available on the Earth Update data site. To complete the activity, students will need to access the Space Update multimedia collection, which is available for download and purchase for use in the classroom.
ZOOM guest Amy wants to be a meteorologist and volunteers at a …
ZOOM guest Amy wants to be a meteorologist and volunteers at a weather observatory. In this adapted video segment, she shows us instruments used to predict the weather and describes how air pressure affects weather patterns.
No restrictions on your remixing, redistributing, or making derivative works. Give credit to the author, as required.
Your remixing, redistributing, or making derivatives works comes with some restrictions, including how it is shared.
Your redistributing comes with some restrictions. Do not remix or make derivative works.
Most restrictive license type. Prohibits most uses, sharing, and any changes.
Copyrighted materials, available under Fair Use and the TEACH Act for US-based educators, or other custom arrangements. Go to the resource provider to see their individual restrictions.