In this activity, students discover the relationship between an object's mass and …
In this activity, students discover the relationship between an object's mass and the amount of space it takes up (its volume). Students learn about the concept of displacement and how an object can float if it displaces enough water, and the concept of density and its relationship to mass and volume.
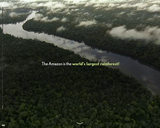
Finding themselves in the middle of the Amazon rainforest after a plane …
Finding themselves in the middle of the Amazon rainforest after a plane crash, students use map scales, keys, and longitude and latitude coordinates to figure out where they are. Then they work in groups to generate ideas and make plans. They decide where they should go to be rescued, the distance to that location, the route to take, and make calculations to estimate walking travel time.
In this lesson, the students will discover the relationship between an object's …
In this lesson, the students will discover the relationship between an object's mass and the amount of space it takes up (its volume). The students will also learn about the concepts of displacement and density.
The Council on Foreign Relation's (CFR) "Deforestation in the Amazon" InfoGuide provides …
The Council on Foreign Relation's (CFR) "Deforestation in the Amazon" InfoGuide provides a compelling look at the causes and consequences of deforestation in the Brazilian Amazon and is available online in English and Portuguese. CFR InfoGuides are a multimedia series to promote understanding of complex foreign policy issues.
In this lesson, students find their location on a map using Latitude …
In this lesson, students find their location on a map using Latitude and Longitudinal coordinates. They determine where they should go to be rescued and how best to get there.
In this lesson, the students will summarize their experiences in the Amazon …
In this lesson, the students will summarize their experiences in the Amazon rainforest by developing and presenting a briefing for a T.V. evening news program.
In this activity, the students will develop a briefing for a T.V. …
In this activity, the students will develop a briefing for a T.V. evening news program that summarizes their experiences surviving in the Amazon rainforest. The students will have the opportunity to role play as interviewer and interviewee in presentations to the class.
In this activity, the students will investigate a variety of plants and …
In this activity, the students will investigate a variety of plants and animals common to the Amazon through research. They will determine the plant or animal characteristics that make them edible or useful for the trip and learn to categorize them by comparing similarities and/or differences.
In this lesson, the students will investigate what types of plants and …
In this lesson, the students will investigate what types of plants and insects they could eat to survive in the Amazon. They will research various plants and/or insects and identify characteristics that make them edible or useful for the trip. The students will create posters and present their findings to the class.
In this activity, the students will use wax paper shaped as leaves …
In this activity, the students will use wax paper shaped as leaves and kite string to build a shelter to protect them from the rain. The students will then test the shelters for durability and water resistance.
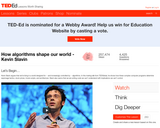
Kevin Slavin argues that we're living in a world designed for -- …
Kevin Slavin argues that we're living in a world designed for -- and increasingly controlled by -- algorithms. In this riveting talk from TEDGlobal, he shows how these complex computer programs determine: espionage tactics, stock prices, movie scripts, and architecture. And he warns that we are writing code we can't understand, with implications we can't control. A quiz, thought provoking question, and links for further study are provided to create a lesson around the 15-minute video. Educators may use the platform to easily "Flip" or create their own lesson for use with their students of any age or level.
This course provides students with concepts, techniques and tools to design, analyze, …
This course provides students with concepts, techniques and tools to design, analyze, and improve core operational capabilities, and apply them to a broad range of application domains and industries. It emphasizes the effect of uncertainty in decision-making, as well as the interplay between high-level financial objectives and operational capabilities. Topics covered include production control, risk pooling, quality management, process design, and revenue management. Also included are case studies, guest lectures, and simulation games which demonstrate central concepts.
In this activity, students conduct an investigation to purify water. They engineer …
In this activity, students conduct an investigation to purify water. They engineer a method for cleaning water, discover the most effective way to filter water, and practice conducting a scientific experiment. Through this activity and its associated lesson, student teams follow the steps of the engineering design process related to water treatment, as done by practicing engineers, including constructing and testing their designs.
The Lost in the Amazon curricular unit is a series of minds-on …
The Lost in the Amazon curricular unit is a series of minds-on and hands-on engineering activities based on an adventure scenario set in the Amazon rainforest in Brazil. Students imagine themselves to be a team of EnviroTech engineers returning to the U.S. from a conference in Brasilia, Brazil. When their plane crashes deep in the Amazon forest, they work in groups to overcome various obstacles in their quest to survive and reach the nearest city as quickly and safely as possible. Motivated by this adventurous theme, students discover, learn and apply the following: 1) classification of plants and insects; 2) general categorizing skills; 3) process skills: problem solving and critical thinking; 4) scientific testing and experimentation; 5) materials properties.
Everyday we are bombarded with the word "global" and encouraged to see …
Everyday we are bombarded with the word "global" and encouraged to see globalization as the quintessential transformation of our age. But what exactly does "globalization" mean? How is it affecting the lives of people around the world, not only in economic, but social and cultural terms? How do contemporary changes compare with those from other historical periods? Are such changes positive, negative or simply inevitable? And, finally, how does the concept of the "global" itself shape our perceptions in ways that both help us understand the contemporary world and potentially distort it? This course begins by offering a brief overview of historical "world systems," including those centered in Asia as well as Europe. It explores the nature of contemporary transformations, including those in economics, media & information technologies, population flows, and consumer habits, not through abstractions but by focusing on the daily lives of people in various parts of the world. This course considers such topics as the day-to-day impact of computers in Silicon Valley and among Tibetan refugees; the dilemmas of factory workers in the US and rural Java; the attractions of Bombay cinema in Nigeria, the making of rap music in Japan, and the cultural complexities of immigrant life in France. This course seeks not only to understand the various forms globalization takes, but to understand its very different impacts world-wide.
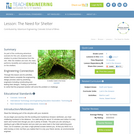
In this lesson, the students will build a shelter in order to …
In this lesson, the students will build a shelter in order to protect themselves from the rain. After the shelters are built, the class will perform durability and water proof testing on the shelters.
At this stage of the "Lost in the Amazon" (hypothetical) adventure, students …
At this stage of the "Lost in the Amazon" (hypothetical) adventure, students determine what supplies they will take with them to survive their trip through the Amazon. They use estimation and basic math skills to determine how much they can carry and what they can use to survive in the jungle environment as they travel on to their destination.
No restrictions on your remixing, redistributing, or making derivative works. Give credit to the author, as required.
Your remixing, redistributing, or making derivatives works comes with some restrictions, including how it is shared.
Your redistributing comes with some restrictions. Do not remix or make derivative works.
Most restrictive license type. Prohibits most uses, sharing, and any changes.
Copyrighted materials, available under Fair Use and the TEACH Act for US-based educators, or other custom arrangements. Go to the resource provider to see their individual restrictions.